
Silane Content Influences Physicochemical Properties in Nanostructured Model Composites
Abstract
Objective. To determine the effect of organosilane content on the physicochemical properties of model composites formulated with nano-sized fillers. Further details about composite materials and treatment protocols are accessible for you to learn on our website in Direct Restoration section.
Methods. Model composites were formulated with dimethacrylate-based monomers, a photoinitiator/co-initiator system and silicon dioxide nano-sized fillers treated with different amounts of 3-methacryloxypropyltrimethoxysilane (MPTS): 1.0 (G1%), 2.0 (G2%), 5.0 (G5%), 7.5 (G7.5%) and 10 (G10%) wt.% relative to SiO2. Non-silanized fillers (G0%) were used in the control group. Degree of conversion (DC) was assessed by Fourier-transformed infrared spectroscopy (ATR-FTIR). Knoop hardness (KHN) and elastic modulus were determined before and after water storage for 4 months. Water sorption (Wsp) and solubility (Wsl) were calculated by successive mass determinations in analytical balance. Surface gloss and roughness were characterized before and after toothbrushing simulation.
Results. With the exception of those fillers treated with 1% MPTS, DC was not dependent on the silane content. Within the silanized groups, G1% showed the lowest initial and final KHN, without statistical difference from G0%. The elastic modulus was not affected by the silane content, regardless of the storage condition, but those groups formulated with at least 5% silane presented improved values after storage. Silane content did not affect the WSl, but affected Wsp, in which those groups formulated with at least 2 wt.% of MPTS produced a more resistant material than G0%. The use of treated particles with at least 2 wt.% of silane was able to produce materials that did not change their gloss after the brushing process. Additionally, these materials presented lower surface roughness than G0% after the brushing process (p < 0.05).
Significance. The concentration of MPTS affected the physicochemical properties of nano- filled composites. Therefore, 2 wt.% of silane was the optimized quantity to produce materials resistant to degradation, both in bulk and surface properties.
1. Introduction
Restorative dental composites are prone to degradation due to exposure in the oral environment [1,2]. Physical and chemical factors such as water, acids, salivary enzymes, and bacterial metabolism products are involved in chemical degradation and could jeopardize the surface integrity of a composite restoration [3–6]. In this context, properties such as hardness and surface texture may degrade [1,7], decreasing the wear resistance and long-term clinical performance of composite restorations [8].
Solvent uptake and hydrolytic degradation are usual experiences for dental polymers, due to the release of unreacted reagents and degradation products [1]. Individual variables such as the masticatory frequency and strength, occlusal contacts, and diet profile are also essential aspects related to materials’ resistance to chemical and mechanical degradation [9]. Not only the intraoral factors but also the composites´ constituents and concentration have an important response against materials’ degradation [10,11].
Resin composites are basically formulated with inorganic fillers and an organic blend of monomers, and they are widely used as dental material [12]. While the organic blend is responsible for the dental bonding ability and the possibility to manipulate the material at room temperature, inorganic fillers can modify aesthetics characteristics, increase mechanical properties, and according to the concentration, to improve the chemical stability [12]. To effectively act, inorganic fillers should be bonded with the organic blend via the interconnection of a coupling agent [13].
Organozirconate, 4-methacryloxyethyl trimellitic anhydride (4-META), organotitanate, and organosilanes are commonly used as coupling agents to coat the surface of inorganic fillers [14]. Coupling agents work as a bridge, connecting both phases of composite resins via covalent bond [15,16]: the monomer blend and the inorganic fillers [14]. Although these agents represent a low fraction within composites formulation, they have a significant effect on their properties[16]. The coupling agents act in the stress transference from the polymer to the inorganic fillers, reinforcing the composite, and improving the filler distribution through the organic matrix [14]. Besides enhancing properties such as the flexural strength, coupling agents reduce the hydrolytic degradation of composite resins [17].
Organosilanes have been used in dentistry for more than fifty years [14]to compose the interfacial segment between the continuous phase of monomers/oligomers and the dispersed phase of fillers [18]. These molecules are organic silicon combinations with functional groups that impart their reaction with inorganic and organic structures [18]. When the organic radical presents an active functional group, such as methacrylate, organosilanes are very useful in creating hybrid structures [18]. 3-methacryloxypropyltrimethoxysilane (MPTS) has been extensively used in dental materials due to its efficiency and also due to its lower cost than other components (like organozirconates) [14]. MPTS is a bifunctional molecule that is able to interact with itself, fillers, and monomers. It forms siloxane bonds (Si OS i) via reaction with oxides or hydroxyl groups on the particles’ surfaces [14,19] and carbon-carbon covalent bonds with the monomers [18]. Commonly applied fillers such as silicon dioxide (SiO2), silicate glasses, and quartz in micro and nanoscale size have been functionalized with MPTS [14].
It was already demonstrated that the amount of coupling agent needed to coat the filler particles could affect dental composite’s behavior [14,15,17,20]. While the insufficient coverage leads to non-homogeneous dispersion within and bond to the polymer, the excess may also drawback the mechanical properties. To overcome these issues, studies have investigated the optimal amount of coupling agents on fillers silanization [13–15,17], but just a few with nano-sized fillers [15], to which the amount of silane might significantly impact due to the increased surface area to volume ratio.
The use of nano-sized filler particles to resin composite formulations’ has increased in recent years. Therefore, it is mandatory to perform further investigations on this issue, especially over the surface properties, as they are related to materials aesthetics and biofilm formation over time. Due to the aforementioned facts, the present study aimed to determine:
the effect of MPTS amount on the physicochemical properties of model composites formulated with nano-sized fillers
with possible effects on the degree of conversion, Knoop hardness and elastic modulus before and after storing in water, water sorption, water solubility, surface gloss and surface roughness before and after toothbrushing simulation; and
The research hypothesis tested was that:
the use of different concentrations of MPTS affects dental composites’ properties.
2. Materials and methods
2.1. Filler silanization
Spherical silica (SiO) particles, with an average diameter of 40 nm, (Aerosil OX50, Evonik, Piscataway, NJ, USA) were silanized with organosilane 3-metacrilioxipropil trimetoxisilano (MPTS, Sigma-Aldrich, St. Louis, Missouri, USA). The silanization methodology was performed according to previous studies [15,21,22]. The minimum amount of silane to cover the filler particles was calculated by using the following Eq. (1):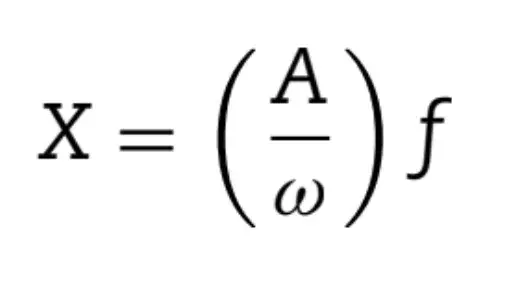 Where, A is the silica surface area (Aerosil OX50 = 50 m2/g); - is the coverage surface area / 1 g of silane (MPTS = 2525 m2/g); f is the amount of silica in grams. According to this equation, to every 5.0 g of silica, 0.1 g of silane is necessary in order to achieve a uniform minimum coverage (only 2 wt.% of silane). Thus, the organosilane, for each experimental group, was added at 1.0, 2.0, 5.0, 7.5, and 10 wt.% relative to silica concentration.
The nanoparticles of silica, the organosilane MPTS, the solvent (cyclohexane, 100 mL) and n-propylamine (0.1 ± 0.01 g) were stirred at room temperature for 30 min, then for further 30 min at 60 ± 5 ◦C in a magnetic stirrer (Model Q261A11 - Quimis). The mixture was then placed on a rotary evaporator (Model G344B1 - Quimis) at 60 ± 5 ◦C in order to remove any solvent. The resulting powder was heated to 95 ± 5 ◦C for one hour on a rotary evaporator and then dried in the oven (Model 22-Q317 M - Quimis) at 50 ◦C for 48 h. The silanized fillers were carefully powdered by using a glass piston.
2.2. Energy-dispersive X-ray (EDS) analysis
Energy-dispersive X-Ray (EDS) analysis using an SEM (JSM-6510LV - Jeol) were used to identify the chemical content of inorganic filler surfaces after the silanization process. Approximately 10 mg of each filler silanized with different percentages 1.0, 2.0, 5.0, 7.5, and 10 wt.% relative to silica concentration were fixed with a double carbon tape in stubs and coated with carbon. An electron beam reached on the sample generating a small amount of X-rays, quantifying the elements present in each group.
2.3. Model composite formulation
The mixture 2,2 bis[4-2(2-hydroxy-3-methacryloxypropoxy)phenyl] propane (Bis-GMA): triethyleneglycol dimethacrylate (TEGDMA) (Esstech Inc.,Essington PA, USA) was used at ratio 50:50 wt.%. To this, 0.5% camphorquinone (ESSTECH Inc., Essington, PA, USA) and 1 mol% ethyl 4-dimethylaminobenzoate (EDMAB) (Sigma-Aldrich, Chemie, Steinheim, Germany) were added as photoinitiator/co-initiator system. The silanizated inorganic fillers with different amounts of organosilane (1.0, 2.0, 5.0, 7.5 and 10 wt.% relative to silica concentration) were added to the organic blend at 60 wt.% and the composites were hand-mixed. Groups were named according to the amount of organosilane used and being arranged as follows: G0%, G1%, G2%, G5%, G7.5% and G10%. Fig. 1 display components in the formulation of the nanostructured model composites. All samples were photoactivated for 40 s with a light-curing unit (Radii Cal, SDI, Australia) with 1140 mW/cm2. The irradiance was constantly checked with a radiometer (LED Radiometer, Demetron SDS Kerr, Middleton, WI, USA), standardized at a distance of 0.5 mm between the photopolimerizer’s tip and the curing material. The same curing unit and conditions were used for all subsequent methodolo- gies.
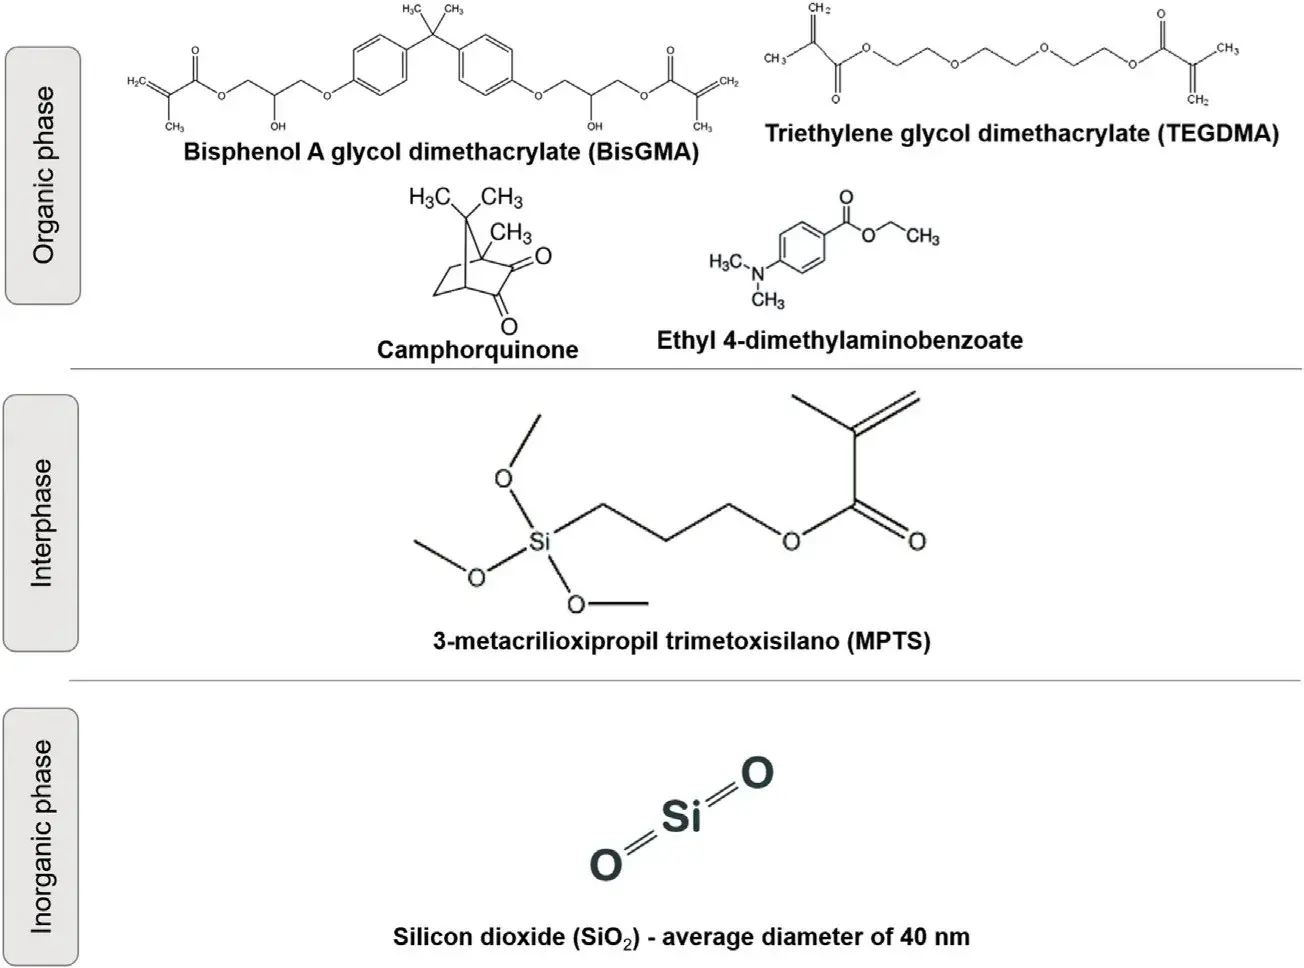 Fig. 1 – Illustrative image of all components in the formulation of the nano-size filled model composites.
2.4. Degree of conversion
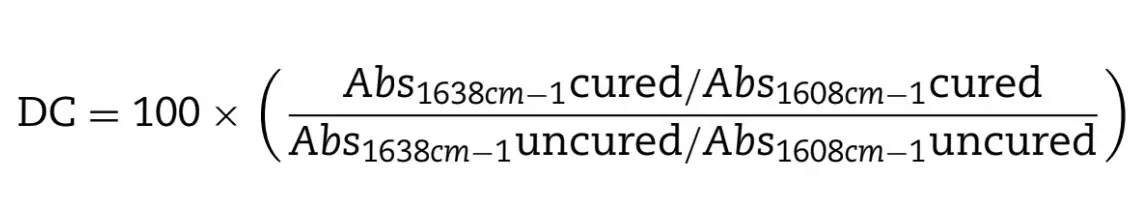
The degree of conversion (DC) was determined by Fourier Transform Infrared Spectroscopy (FTIR, Prestige 21 Shimadzu, Kyoto, Japan) using the technique with the attenuated total reflectance (ATR) device. Increments of the composite resins were placed on the diamond crystal on the ATR, and the spectra were obtained with 32 scans and 4 cm−1 resolution. After that, the increments were photoactivated on the ATR. The peaks of 1608 cm−1 and 1638 cm−1 were used corresponding to carbon-carbon double bonds in the aliphatic chain and the aromatic chain, respectively. The DC of each composite resin was calculated (Eq. (2)) by using the bands’ area of both signs of the polymerized and unpolymerized resins [23].
2.5. Knoop hardness
Resin composites were placed on metallic molds and covered with a polyester strip before the photoactivation. Five discs per group were prepared (Ø 4 mm × 2 mm h).
After 24 h, stored in a dark and dry environment, the irradiated surfaces were indented using 25 N of load for 15 with a Knoop diamond tip at five different locations (Micromet 5104, Buehler, Lake Bluff IL, USA). After initial measurements, samples were stored in distilled water, and Knoop hardness measurements were repeated after 4 months.
2.6. Elastic modulus
Twenty bar-shaped samples were prepared in a metallic mold (with 1 mm thickness, 2 mm wide, 10 mm length dimensions) for each material. Composites were placed in a single increment. Each uncured sample had its top and bottom covered by polystyrene strips before the photoactivation. The surfaces were then grounded to remove irregularities with 600-grit SiC paper. Ten samples per group were stored in distilled water at 37 ◦C. After 24 h, samples were measured with a digital caliper and submitted to the flexural strength test using a three-point bend method in a universal testing machine (DL2000, EMIC, São José dos Pinhais, PR, Brazil) with 5 kgf load cell and displacement of 0.5 mm/min.The elastic modulus (EM) was obtained from the stress-strain curve in the elastic regime of materials behavior and from the final load applied for material rupture using the following Eq. (3):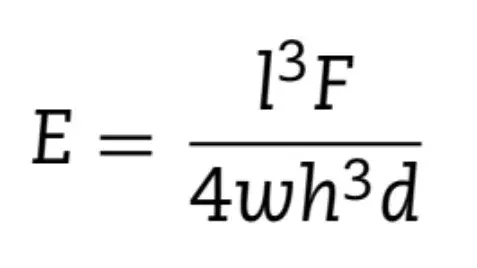
where, “l” is the distance (mm) between the lower points (6 mm), “F” is the load (N) applied, “h” is the height (mm) of the samples, w is the width (mm) and “d” is the deflection (mm) of the samples over the load “F” during the elastic regime. The other ten samples were tested after 4 months of distilled water storage, that was weekly changed, at 37 ◦C.
2.7. Water sorption and solubility
The model composites were inserted in a single increment in a metal mold between polyester strips and photoactivated as described above. Five discs per group were prepared (Ø 6 mm × 1 mm h) [10,23]. The samples were stored in a desiccator with silica gel for 24 h, at 37 ± 1 ◦C. After 24 h, the samples were transferred to a second desiccator at 25 ± 1 ◦C for 2 h, and then they were weighed in analytical balance accuracy 0.01 mg, (XS105 DU, Metler-Toledo, Leicester, UK). The samples were repeatedly weighed every 24 h until a constant mass (m1) was obtained (range smaller than ±0.1 mg for three consecutive weighing — m1). At this point, the volume of each sample was determined with a digital caliper (Mitutoyo, Japan).
After the final drying, the samples’ dimensions (thickness and diameter) were measured with a digital caliper in order to calculate the volume (V) in mm3. Afterwards, samples were individually immersed in 10 mL of distilled water at 37 ± 1◦C, and weighed in 24 h-cycles until reaching the equilibrium (m2). After, samples were reconditioned to constant mass (m3) in the desiccators using the cycle described above for m1. The following calculations were applied to obtain water sorption (Wsp, Eq. (4)) and water solubility (Wsl, Eq. (5)) during the course of water immersion and drying were obtained in g/mm3: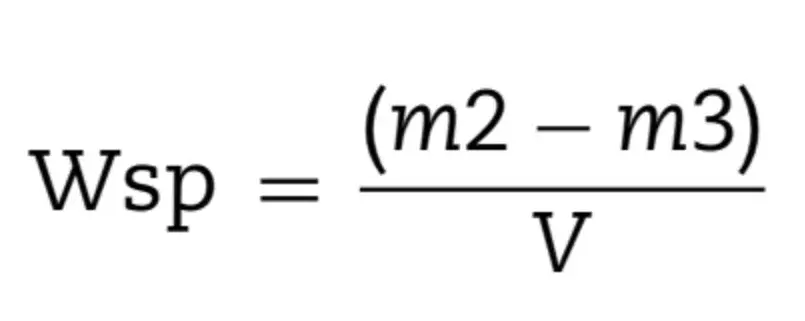
and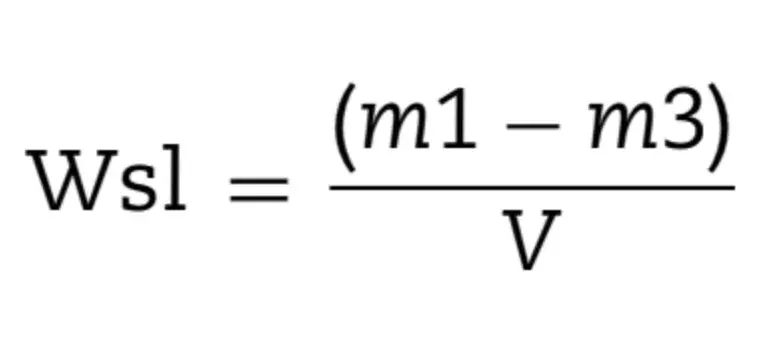
2.8. Gloss retention
Six samples per group (10 mm diameter × 2 mm thickness) were prepared as described for Knoop hardness assessment. The surface gloss was measured with a glossmeter (Novo Curve, Rhopoint, Bexhill-on-Sea, England), which was calibrated against a black glass standard provided by the manufacturer. The measurements were taken at the center of each sample. Five measurements per sample were performed at 60◦ of light incidence and reflection angles relative to the vertical axis with a window of 2 × 2 mm. The gloss, determined in gloss units (g.u.), was evaluated before and after toothbrush abrasion.
2.9. Surface roughness
Surface roughness was checked in the same samples made for the gloss retention analyses. A profilometer (Taylor Hobson Precision Instrument, Taylor Hobson Ltd, Leicester, England) was used to characterize the surface roughness using a diamond stylus with a radius of 5 m, tip angle of 90◦ and a constant speed of 1.00 mm/s across the surface applying 6 mN.
Six lines were evaluated on each sample: three in horizontal and three in perpendicular directions. The cut-off length was 0.25 mm and the measuring length was 2 mm. The amplitude parameter Ra was used for surface roughness characterization before and after toothbrush abrasion.
2.10. Toothbrush abrasion
A custom-made machine was used to simulate the toothbrushing process. The machine presented four separate devices to perform the abrasion in four samples at the same time, but individually. A toothbrush (Dr. Veit Soft-touch, Dr. Veit Produtos Odontológicos, Rio de Janeiro, Brazil) was fixed in the toothbrush holder and the testing machine was adjusted to apply 2.5 N with a vertical load on the samples during horizontal movement of the toothbrush throughout the test. A toothpaste (Colgate Total, Colgate-Palmolive, Manchester, UK) was used at the proportion of 2:1 (water:toothpaste) according to ISO/TS 1469-1 [30]. All specimens were brushed with inverse strokes 20,000 times, which corresponds to approxi- mately 2 years of tooth brushing [4]. The toothbrush and the water:toothpaste mix (12 g per each time) were replaced for each sample. After the abrasion, the samples were removed from the machine, rinsed with water, cleaned in the ultrasonic bath with distilled water for 5 min, and gently air-dried. The surface gloss and roughness measurements were repeated.
Data of DC, Wsp, and Wsl were submitted to one-way analysis of variance (ANOVA) followed by Tukey’s post-hoc test. Data from Knoop hardness, elastic modulus, surface roughness, and gloss retention were submitted to two-way ANOVA and Tukey’s post-hoc test. Statistical significance was considered at 0.05. There are additional details about composite restorations that you can obtain in our course "International schools working with composite restorations".
3. Results
Table 1 displays the elemental composition on the untreated SiO2 and SiO2 treated with different amounts of MPTS: 1, 2, 5, 7.5, and 10 wt.% relative to SiO2 weight. The EDS analysis showed that with increasing the content of MPTS, the per- centage of silicon element (Si) increases, suggesting that more compounds containing Si were present from 0 to 10 wt.% of MPTS due to the use of the bifunctional coupling agent. Fig. 2 shows DC values, which ranged from 47.6 (±3.2) % for G1% to 56.6 (±1.2) % for G10% (p = 0.045). When the inorganic fillers were treated with 1.0 wt.% of organosilane, DC was statistically lower (47.6 ± 3.2 %) compared to G0% (56.3 ± 0.9 %). No statistically significant differences were observed for model composites formulated without and with 2, 5, 7.5, or 10 wt.% of the organosilane.
Table 2 details Knoop hardness and elastic modulus values before and after storage in distilled water. G1% presented the lowest initial values of KHN (15.8 ± 1.3) compared to the other Fig. 2 – Degree of conversion in percentage of the experimental composite resins containing different amounts of the organosilane MPTS. Different uppercase letters indicate statistically significant difference among groups (p < 0.05). silanized groups, without difference for G0%. There was no significant difference within the same group compared to initial and final Knoop hardness (p > 0.05). G0% presented lower final values of KHN compared to the silanized groups with at least 2 wt.% of the organosilane.
Regarding the elastic modulus (Table 2), no statistical difference among groups before or after storage in distilled water (p > 0.05) was observed. Groups containing at least 5 wt.% of organosilane presented higher elastic modulus after water storage compared with the initial values (p < 0.05). The values of Wsp and Wsl are presented in Table 3. Model composites formulated with non-silanized fillers (G0%) presented higher Wsp than those with at least 2 wt.% silane (p < 0.05). G1% presented intermediate results (p > 0.05). Water solubility was not dependent on the silane (p > 0.05). Surface gloss and surface roughness values are presented in Table 4. Gloss values ranged from 51.1 (±2.0) G.U. for G5% to 66.5 (±3.8) G.U. for G10% (p < 0.05) before toothbrush abrasion and from 48.5 (±2.1) G.U. for G1% to 66.0 (±4.3) G.U. for G7.5% after toothbrushing (p < 0.05).
The toothbrush simulation did not affect groups containing 2, 5, 7.5, and 10 wt.% of organosilane. However, G0% and G1% presented a reduction in the gloss after toothbrushing simulation. After this event, G1% presented the lowest mean value of gloss, without difference for G5% (p > 0.05), but lower than the other groups (p < 0.05).
Surface roughness did not differ among groups in the immediate analysis (p > 0.05) but after the toothbrushing process, the values ranged from 0.22 (±0.06) m for G1% to 0.08 (±0.02) m for G7.5% and G10%. At the end, G0% and G1% showed higher surface roughness than the other groups with at least 2% of MPTS (p < 0.05).
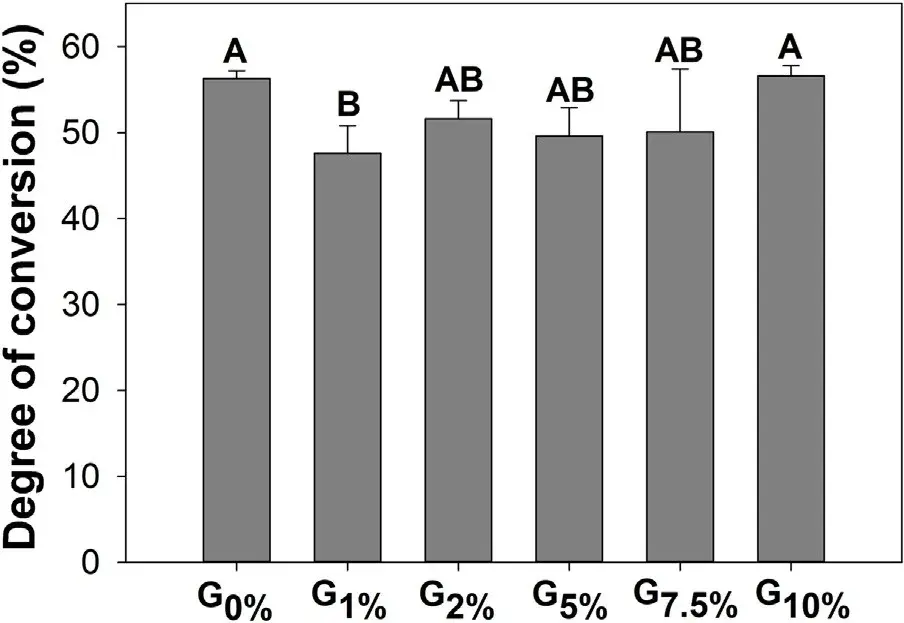 Fig. 2 – Degree of conversion in percentage of the experimental composite resins containing different amounts of the organosilane MPTS. Different uppercase letters indicate statistically significant difference among groups (p < 0.05).
Table 1 – Elemental composition on the untreated silicon dioxide (SiO2) and SiO2 treated with different amounts of 3-methacryloxypropyltrimethoxysilane (MPTS).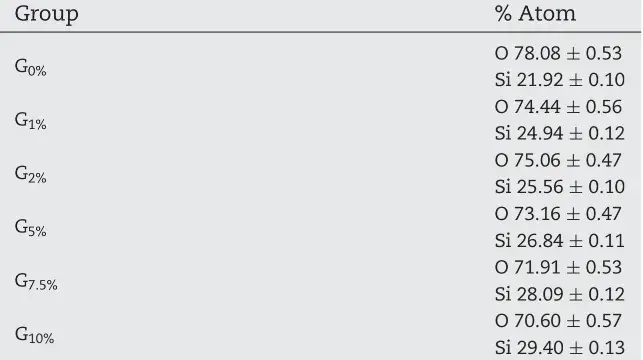
Table 2 – Mean (sd) values of Knoop hardness and elastic modulus of nanostructured model composites before and after storage in water for four months.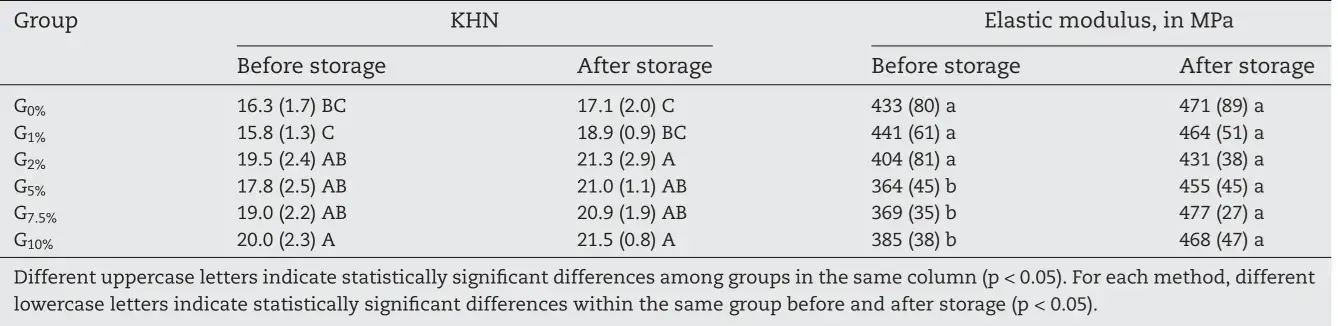
Table 3 – Mean (sd) values of water sorption (Wsp) and water solubility (Wsl) of the experimental composites tested.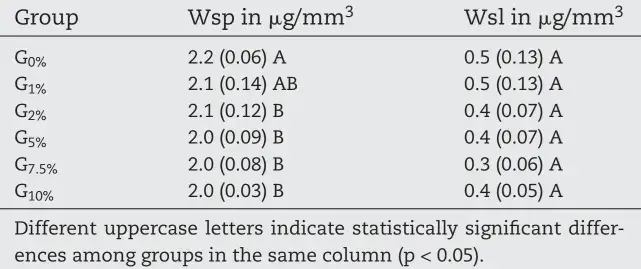
Table 4 – Mean (sd) values of surface gloss and roughness of the experimental composites before and after toothbrush abrasion.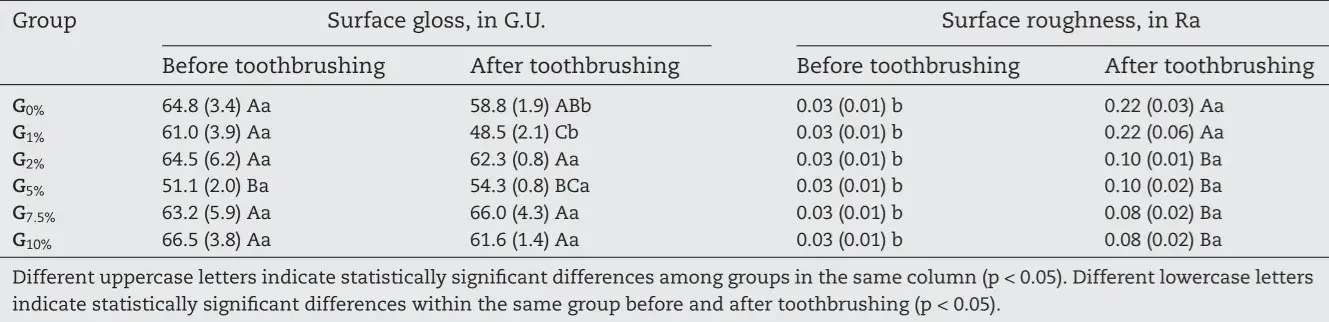
4. Discussion
Considering the overall results from the current investigation, it is possible to state that the MPTS concentration affected immediate and long-term properties of model composites formulated with nano-sized fillers. Thus,the research hypothesis was accepted.
The group with 2 wt.% of MPTS showed suitable DC and maintained the KHN and elastic modulus of the composite after four months in water storage. Moreover,the surface gloss of G2% did not change after toothbrushing simulation, and this group showed lower surface roughness and lower Wsp com- pared to G0% and G1%. Above 2 wt.% of MPTS, there were no major improvements in the properties evaluated.
The fillers were characterized via EDS and confirmed a higher percentage of Si from 0 to 10 wt.% of MPTS in the experimental groups. This could suggest that by raising the MPTS concentration, there was an increasing amount of molecules containing Si. According to a previous study that used similar conditions, the increased silane attached on SiO2 surface from 1 to 10 wt.% of MPTS was determined via thermogravimetric analysis (TGA) [15]. TGA also revealed thatfor the same parameters used in the currentinvestigation,there is only chemically attached organosilane on SiO2 because those molecules physically adsorbed are removed at temperatures from 50 to 150 ◦C, such as those used at the end of the silanization process [15]. Therefore, it is possible to predict that the MPTS applied in the experimental groups was also chemically attached to SiO2.
A proper DC is desired for dental composites since unreacted monomers can decrease their hydrolytic stability [10], physical properties [24], and biocompatibility [25]. When 1 wt.% of MPTS was applied, the DC decreased in comparison to G0%, and statistically higher values were achieved by increasing MPTS addition up to 10 wt.%. A previous study reported DC of 75 % when SiO2 was treated with MPTS, while the untreated group showed 67 % [13]. It was suggested that when the organosilane was present, the C C bonds of MPTS participate and increase the monomer conversion [13]. Also, the incomplete organosilane coverage on the fillers negatively impacts their distribution, jeopardizes the composite’s mechanical properties, and increases its viscosity [15,20]. The increase of composites’ viscosity may have been the reason for the lowest DC found for G1% since DC is related not only to chemical composition but also to materials’ viscosity [15]. For composites formulated with 10 wt.% of MPTS, the high DC value might be explained by the fact that such a group also presented the lowest viscosity.
Although it was not evaluated in the current study, it was clear that the composites vary among them during their manipulation. The rheology properties investigation is encouraged to clarify if the modification of MPTS content is an alternative to adjust composites’ viscosity and change their application.
Besides the lower DC achieved for G1%, the physical property also varied depending on MPTS concentration. By increasing the amount of MPTS, the initial KHN values also increased. More specifically, for G10% 20.0 (±2.3) KHN was detected, while for G0% this value dropped to 16.3 (±1.7) (p < 0.05). With at least 2 wt.% of MPTS, the groups were prone to reach enhanced KHN. More than 1 wt.% of MPTS may have promoted a more successful bond between the matrix and filler particles, increasing KHN. Despite these changes, according to intragroup analysis, no differences were detected comparing values before and after water storage. When the KHN was analyzed after water storage, in all experimental groups from 2 wt.% of MPTS addition, the values remained superior to that found for G0%, corroborating with the findings for DC.
It has been considered that organosilanes can increase the elastic modulus of composite by improving stress distribution and stress transmission from the organic polymer matrix to inorganic fillers [26]. However, regardless of the differences observed for DC and KHN, the MPTS concentrations did not provide prominent consequences in the elastic modulus. On the other hand, those groups formulated with at least 5% MPTS showed improved values after water storage than the initial ones as a probable consequence of delayed conversion. Previous studies reported superior DC for composite resins after aging [27,28] because of the elution of unreacted monomers or to the conversion of molecules that were previously entrapped in the resin matrix [27,29]. Overall, the results observed for the elastic modulus are in line with the aforementioned study [19], which showed no significant differences for immediate flexural strength and immediate flexural strength modulus of composite resins with 0–10 wt.% of organosilane addition [15]. Long-term analyses are valuable for resin-based restorative materials due to their relationship with intraoral conditions, mainly involving hydrolytic degradation and plasticization. Therefore, the current study analyzed not only the immediate Knoop hardness and elastic modulus but also the effect on these properties after four months of storage in water.
When used in excess, the organosilane molecules are arranged in multilayers on filler’s surface [15]. While the first layer of MPTS is linked to the filler via covalent bonds, the second layer of MPTS is connected to the previous one via hydrogen bonds [15]. There is no direct interaction between this second layer of MPTS and the filler, which was suggested as a reason to make the composite more vulnerable to hydrolysis and loss of its mechanical properties [15]. On the other hand, with MPTS above 2.5 wt.%, it was suggested that the organosilane presents random orientation around SiO2, with perpendicular and parallel orientation [15] and this phenomenon - mainly the parallel direction - increases the content of MPTS bonding SiO2 to monomers [13]. The orientation of the MPTS on SiO2 was not analyzed in the current investigation, but it was pre- viously demonstrated by Sideridou and Karabela [15] that with concentrations of 5, 7.5, and 10 wt.% of MPTS, there was a shift in the spectra from single 1706 cm−1 peak to overlaps with 1722 cm−1 peak. In other words, from higher concentrations than 2.5 wt.% of MPTS, there were not exclusively carbonyl groups linking to the hydroxyls of SiO2 (peak at 1706 cm−1, parallel monomolecular coverage) but also free carbonyl groups (peak at 1722 cm−1, perpendicular molecular coverage) [15]. Probably the current composites showed the same organization where those groups with concentrations from 5 to 10 wt.% of MPTS presented perpendicular molecular coverage, and 2 wt.% of MPTS had parallel monomolecular coverage.
Based on the present out- comes, even with a possible parallel organization of MPTS on G2%, the range between “few and exclusively parallel orientation” and “excess and formation of multilayers” started from 2 wt.%, and we did not observe impairment of up to 10 wt.%.
The hydrolytic degradation through which polymers are subjected to face in the oral environment can affect their clinical performance over time. This process is formulation- dependent, and the hydrophilicity of the overall material dictates the amount of Wsp and Wsl [1,23]. There were no differences among groups for Wsl, suggesting that regardless of the MPTS concentration, there were no effects on the amount of leached components from the composites. However, from 2 wt.% of MPTS, the Wsp decreased compared to G0%. It is possible that the diffusion and water uptake were facilitated by the absence or low (1 wt.%) amount of MPTS, increasing the Wsp for G0% and G1%. Nano-sized voids were probably more predominant for G0% and G1% due to weaker interphase between the SiO2 and the monomers, exposing more hydrophilic areas on the SiO2 surface of these two groups. In this way, the water could be more easily absorbed at SiO2/polymer interface [30], leading it to hydrolyzation [17]. On the other side, composites with SiO2 treated with atleast 2 wt.% of MPTS were more prone to form covalent bonds between the nanoscale particles and the blend, reducing the Wsp.
Composite resins must maintain surface smoothness overtime to not increase the susceptibility of biofilm accumulation and to retain a reliable and pleasing aesthetic [31]. This is the first study that analyzes the effect of organosilane concentration in the gloss and roughness of nanocomposites after toothbrushing simulation. The surface gloss depends on how the lightinteracts and reflects from the surface [32] and,therefore,the refractive index ofthe particle (1.46 for SiO2, according to the manufacturer) also plays an important role in how the light is reflected. Moreover, the gloss retention is related to the composite’s roughness over time, and it decreases when the roughness increases [32].
Gloss is measured by directing a light beam on the surface and by quantifying the reflected light. When the light is reflected in one single direction, the brightness recorded is high, which indicates a smooth surface and high gloss [33,34]. The incident light angle of 60◦ is considered the most suitable for clinical settings [35] because it is close to the angle in which people observe the dental surface [31]. Toothbrush abrasion did not adversely affect the gloss of groups with MPTS from 2 wt.% addition, but G0% and G1% showed lower gloss surface after the wear compared to their immediate analysis. Even though G5% showed no difference in intragroup analysis, it already initially presented lower value compared to the others, and it maintained this profile after wear, showing lower values compared to G0%, G2%, G7.5%, and G10% and no difference for G1%. Despite maintaining the gloss comparing before and after wear, the best outcomes were achieved for G2%, G5%, and G10% and the rationale for that may be related to MPTS concentration and changes in the surface texture with increased organosilane addition.
Previous studies that evaluated the effect of mechanical abrasion by brushing the composites showed an increased surface roughness after this event [36,37]. Toothbrushing simulation is a method that can be used to analyze the ability of the restorative material to keep gloss and smoothness over time [36]. Even though all groups increased their surface roughness after toothbrushing, G0% and G1% presented statistically higher values than the other groups after toothbrushing. In other words, G0% and G1% showed worse formance compared to groups with at least 2 wt.% of MPTS.
These results corroborated previous findings when it was observed that deficient silane bonding between the inorganic filler and the organic blend could be a reason for reducing the wear resistance of the composites<– –> [44]. The reason for that could be a better bonding between the blend and the filler with more than 1.0 wt.% of MPTS, leading to lower loss of particles for these groups after toothbrushing. Besides the aesthetic consequences, the increase of surface roughness can induce negative biological consequences due to biofilm accumulation on materials’ surfaces [38]. Therefore, the use of nanofilled composite resins with at least 2 wt.% of MPTS could be an alternative to assist in the maintenance of materials’ property and oral health over time.
It is worth to mention that it is a limitation of this study to not have the same amount of inorganic fillers among all groups as the increased contact of MPTS decreases the SiO2 content. The previous research using the same materials showed via TGA that all composites contained about the same amount of inorganic phase [15]. However, it is known that the total surface area of inorganic particles within the composite can influence optical and surface properties [39], and they probably had small differences between organic and inorganic phases among the groups tested. The slight differences found from 0 to 10 wt.% of MPTS could also be explained due to inorganic phase contents. Even with a lower concentration of SiO2 with increasing MPTS concentration, all properties tested remained suitable or improved by increasing MPTS. Additional characterization with scanning electron microscopy are encouraged to evaluate the interface stability.
The chemical and physical properties of the coupling agent used, such as the molecular size, hydrophilicity/hydrophobicity, and the number of reactive sites, as well as its arrangement on the filler surface, can affect the interphase and, consequently, final material’s properties [18]. The organization of organosilanes around the fillers does not depend only on their amount [15], but also the type of coupling agent [40]. MPTS is an organosilane with one vinyl group, three carbons in the main chain, and it is considered bifunctional due to its C C double bond in one segment and Si O CH3 in the other. This coupling agent, as well as the monomers traditionally used for dental resins, presents hydrophilic parts such as ester groups [14,18]. Thus, the excess of MPTS in the interphase could make this site more prone to hydrolysis and condensation, generating silsesquioxane compounds and damaging composites stability [18]. On the other hand, this short organosilane (MPTS) seems to be more prone to be irregularly adsorbed on the particles via random orientation, inducing higher hydrolytic durability in comparison to organosilanes with longer spacer (carbon-carbon) groups. It is considered that longer organosilanes produce ordered monolayers in the chemisorption [40], which can decrease the number of molecules reacting with the surface of the particles [15].
MPTS is still widely used in dentistry, and the balance to find the ideal concentration must be endorsed not only in the immediate physicochemical properties but also in analyses that evaluate the hydrolytic stability. The currentinvestigation adds important information to the current knowledge with regard to surface properties.
5. Conclusion
Within the limitations of the current study, the current outcomes indicate that:
The MPTS concentration affected immediate and long term physical and chemical properties of model composites formulated with nano-sized fillers; and
As a result of functionalization, 2 wt.% of silane was the optimized quantity to produce materials resistant to degradation, both in bulk and surface properties.
You have the opportunity to gather more in-depth information about direct restoration with composite materials in our course "The Biomimetic concept: composite restoration protocols".
List of authors:
Larissa Maria Cavalcante, Lucielle Guimarães Ferraz, Karinne Bueno Antunes, Isadora Martini Garciac, Luis Felipe Jochims Schneider, Fabrício Mezzomo Collaresc
References
Ferracane JL. Hygroscopic and hydrolytic effects in dental polymer networks. Dent Mater 2006;22:211–22.
Takeshig F, Kawakami Y, Hayashi M, Ebisu S. Fatigue behavior of resin composites in aqueous environments. Dent Mater 2007;23:893–9.
Nedeljkovic I, De Munck J, Ungureanu AA, Slomka V, Bartic C, Vananroye A, et al. Biofilm-induced changes to the composite surface. J Dent 2017;63:36–43.
Mirmohammadi H, Kleverlaan CJ, Aboushelib MN, Feilzer AJ. Influence of salivary enzymes and alkaline pH environment on fatigue behavior of resin composites. Am J Dent 2011;24:31–6.
Kusuma Yulianto HD, Rinastiti M, Cune MS, de Haan-Visser W, Atema-Smit J, Busscher HJ, et al. Biofilm composition and composite degradation during intra-oral wear. Dent Mater 2019;35:740–50.
Oskoe SK, Drummond JL, Rockne KJ. The effect of esterase enzyme on aging dental composites. J Biomed Mater Res B Appl Biomater 2019;107:2178–84.
Larsen IB, Freund M, Munksgaard EC. Change in surface hardness of BisGMA/TEGDMA polymer due to enzymatic action. J Dent Res 1992;71:1851–3.
Freund M, Munksgaard EC. Enzymatic degradation of BISGMA/TEGDMA-polymers causing decreased microhardness and greater wear in vitro. Scand J Dent Res 1990;98:351–5.
Demarco FF, Corrêa MB, Cenci MS, Moraes RR, Opdam NJ. Longevity of posterior composite restorations: not only a matter of materials. Dent Mater 2012; 28:87–101.
Collares FM, Ogliari FA, Zanchi CH, Petzhold CL, Piva E, Samuel SM. Influence of 2-hydroxyethyl methacrylate concentration on polymer network of adhesive resin. J Adhes Dent 2011;13:125–9.
De Munck J, Van Meerbeek B, Yoshida Y, Inoue S, Vargas M, Suzuki K, et al. Four-year water degradation of total-etch adhesives bonded to dentin. J Dent Res 2003;82:136–40.
Ferracane JL. Resin composite–state of the art. Dent Mater 2011;27:29–38.
Aydinoglu A, Yoruc ABH. Effects of silane-modified fillers on properties of dental composite resin. Mater Sci Eng C Mater Biol Appl 2017;79:382–9.
Elshereksi NW, Ghazali M, Muchtar A, Azhari CH. Review of titanate coupling agents and their application for dental composite fabrication. Dent Mater J 2017;36:539–52.
Sideridou ID, Karabela MM. Effect of the amount of 3-methacyloxypropyltrimethoxysilane coupling agent on physical properties of dental resin nanocomposites. Dent Mater 2009;25:1315–24.
Drummond JL. Degradation, fatigue, and failure of resin dental composite materials. J Dent Res 2008;87:710–9.
Karmaker A, Prasad A, Sarkar NK. Characterization of adsorbed silane on fillers used in dental composite restoratives and its effect on composite properties. J Mater Sci Mater Med 2007;18:1157–62.
Antonucci JM, Dickens SH, Fowler BO, Xu HH, McDonough WG. Chemistry of Silanes: Interfaces in Dental Polymers and Composites. J Res Natl Inst Stand Technol 2005;110:541–58.
Koelling JG, Kolb KE. Infrared Study of Reaction Between Alkoxysilanes and Silica. ChemComm 1965:6–7.
Mohsen NM, Craig RG. Effect of silanation of fillers on their dispersability by monomer systems. J Oral Rehabil 1995;22:183–9.
Chen TM, Brauer GM. Solvent effects on bonding organo-silane to sílica surfaces. J Dent Res 1982;61:1439–43.
Wilson KS, Antonucci JM. Interphase structure-property relationships in thermoset dimethacrylate nanocomposites. Dent Mater 2006;22:995–1001.
Vidal ML, Rego GF, Viana GM, Cabral LM, Souza JPB, Silikas N, et al. Physical and chemical properties of model composites containing quaternary ammonium methacrylates. Dent Mater 2018;34:143–51.
Ferracane J. Correlation between hardness and degree of conversion during the setting reaction of unfilled dental restorative resins. Dent Mater 1985;1:11–4.
Goldberg M. In vitro and in vivo studies on the toxicity of dental resin components: a review. Clin Oral Investig 2008;12:1–8.
Calais JG, Soderholm KJ. Influence of filler type and water exposure on flexural strength of experimental composite resins. J Dent Res 1988;67:836–40.
Ghavami-Lahiji M, Firouzmanesh M, Bagheri H, Jafarzadeh Kashi TS, Razazpour F, Behroozibakhsh M. The effect of thermocycling on the degree of conversion and mechanical properties of a microhybrid dental resin composite. Restor Dent Endod 2018;43:e26.
Pallikari F, Iosifidou S. A study of aging in dental composites using IR and Raman spectroscopy. E-Polymers 2004;4:793–802.
Andrzejewska E. Photopolymerization kinetics of multifunctional monomers. Prog Polym Sci 2001;26:605–65.
Wang J-Y, Ploehn HJ. Dynamic mechanical analysis of the effect of water on glass bead-epoxy composites. J Appl Polym Sci 1996;59:345–57.
O’Neill C, Kreplak L, Rueggeberg FA, Labrie D, Shimokawa CAK, Price RB. Effect of tooth brushing on gloss retention and surface roughness of five bulk-fill resin composites. J Esthet Restor Dent 2018;30:59–69.
van Dijken JW, Ruyter IE. Surface characteristics of posterior composites after polishing and toothbrushing. Acta Odontol Scand 1987;45:337–46.
Cho LR, Yi YJ, Heo SJ. Effect of tooth brushing and thermal cycling on a surface change of ceromers finished with different methods. J Oral Rehabil 2002;29:816–22.
O’Brien WJ, Johnston WM, Fanian F, Lambert S. The surface roughness and gloss of composites. J Dent Res 1984;63:685–8.
Silikas N, Kavvadia K, Eliades G, Watts D. Surface characterization of modern resin composites: a multitechnique approach. Am J Dent 2005;18:95–100.
Heintze SD, Forjanik M. Surface roughness of different dental materials before and after simulated toothbrushing in vitro. Oper Dent 2005;30:617–26.
Wang L, Garcia FC, Amarante de Araujo P, Franco EB, Mondelli RF. Wear resistance of packable resin composites after simulated toothbrushing test. J Esthet Restor Dent 2004;16:303–14, discussion 14-15.
Ergucu Z, Turkun LS. Surface roughness of novel resin composites polished with one-step systems. Oper Dent 2007;32:185–92.
Salgado VE, Cavalcante LM, Silikas N, Schneider LF. The influence of nanoscale inorganic content over optical and surface properties of model composites. J Dent 2013;41(Suppl 5):e45–53.
Nishiyama N, Ishizaki T, Horie K, Tomari M, Someya M. Novel polyfunctional silanes for improved hydrolytic Stability at the polymer-silica interface. J Biomed Mater Res 1991;25:213–21.