
Does Translucency Influence Cure Efficiency and Color Stability of Resin-Based Composites?
Abstract
Objective. To determine if material’s translucency influences the cure efficiency and color stability of resin-based composites (RBCs). More details about filling materials and direct restoration protocols are accessible for you to learn on our website in Direct Restoration section.
Methods. Four commercially-available RBCs indicated for aesthetic restorations were selected in different translucent/opaque shades: IPS Empress Direct (IED) A3 Dentin, A3 Enamel, Trans 20, and Trans 30; Filtek Z350 XT (FZX) A3D, A3B, A3E, and CT; Estelite Σ Quick (EQ) OA3, A3, and CE; and Opallis (OP) DA3, EA3, and T-Neutral. Color was obtained in the L′ C′ h′ system at three distinct periods: 24h after photoactivation (baseline), after 30 d of water storage (WS), and after 30 d of coffee storage (CS). The translucency parameter (TP) of each RBC was calculated at baseline. The degree of C C conversion (DC) was obtained by Fourier-transform infrared spectroscopy at 0.05mm (top) and 2mm (bottom) surfaces; the cure efficiency considered the bottom/top ratio. The CIEDE2000 color difference (Δ E00) was calculated considering the WS–baseline and CS–baseline values. Data were submitted to two-way ANOVA and Tukey’s post-hoc test (α = 0.05). Pearson’s tests were used to analyze the correlations between TP and DC, and between TP and Δ E00.
Results. For all RBCs, cure efficiency was not affected by materials’ translucency. A positive, significant correlation was observed between TP and DC at the bottom surface for FZX only. For all RBCs, the higher the TP, the higher the !E00. The !E00 was higher after CS than after WS, except for EQ A3. Positive correlation between TP and !E00 were observed for all materials.
Conclusion. The translucency did not influence the cure efficiency but affected the color stability for all RBCs.
Clinical significance. High-translucent RBCs presented lower color stability and should be used carefully
1. Introduction
One of the major causes for failure of resin-based composite restorations in anterior teeth is aesthetics [1]. The mismatch between the tooth structure and material may occur due to technical failure or the material’s discoloration during its clinical lifetime. In direct restorations proper reproduction of all tooth characteristics needs to be considered depending on the clinical situation. Therefore, sometimes it is necessary to use several translucent/opaque shades of a restorative material to achieve the best match between the material and dental tissues from a single tooth. Translucency is one of the most important optical properties to consider when evaluating aesthetics. The translucency of resin-based composites results from the relationship between the refractive indices of the filler particles and resin matrix. The greater the difference, the lower the translucency [2]. It is known that the inorganic filler particles content and type [3–6], organic matrix type and fraction [4,7], may all affect the material’s translucency. Another component that might dictates the materials’ aesthetics over time is the photoinitiator system used in the formulation [8–10]. The association of camphorquinone (CQ) with a tertiary amine remains the most common photoinitiator system in commercial composites. CQ has an intense yellow color, which gives the material a high potential for dis-coloration [9,10]. To overcome the aesthetic problems of this system, alternative photosensitizer molecules were tested, such as phosphine oxide derivatives. The diphenyl(2,4,6-trimethylbenzoyl)phosphine oxide, also known as TPO, is a component already present in some commercial composites [8,11,12]. TPO has demonstrated higher color stability [8,9] and higher curing efficiency than CQ [9,13], albeit having decreased depth of cure [14]. Another attempt to reduce the CQ content, based on a radical amplified photopolymerization (R.A.P. technologyTM), was recently proposed.
Results available for materials formulated with this technology indicate increased degree of C=C conversion (DC), with no reported data regarding color stability [15].
In a previous study involving model composites, improved color stability was observed when alternative photoinitiators were associated with the CQ/amine system, particularly TPO [10]. However, in commercial resin-based composites, manufacturers usually do not disclose or specify the type and/or amount of the components for all available translucent/opaque shades. Even when the materials from the same brand are considered, other differences not restricted to the photoinitiator system are present, including filler loading, and presence of pigments or radical scavengers, for instance.
To achieve high-translucent shades, the manufacturers may decrease the amount of CQ/amine and/or use alternative photosensitizer molecules [11], or even decrease the inorganic content amount [4], which may compromise the cure efficiency and the color stability. Notwithstanding, the data in the literature regarding the influence of each resin-based composite’s component over the physical properties derives from in vitro studies using experimental materials. Despite several studies had investigated the color stability or cure efficiency of commercial resin-based composites, none of them determined the influence of the translucency within each brand on these physical properties.
The aim of this study was to determine the cure efficiency and the color stability of four distinct commercial brands of restorative resin-based composite systems in their different available translucent/opaque shades. The research hypotheses of this study were that for all resin-based composite brands:
high-translucent materials would present lower cure efficiency;
high-translucent materials would present lower color stability.
2. Materials and methods
2.1. Study design
This in vitro study involved distinct factorial designs to evaluate the effect of the translucency over the cure efficiency and color stability of four commercial resin-based composite brands. For each analysis,the sample size was the same of previous studies [9,10]. Translucency was quantitatively assessed by the translucency parameter (TP) formula. For the cure efficiency (n= 6), two factors were evaluated: ‘translucency’ (three or four levels, depending on the commercial brand) and ‘surface’ (top or bottom). For color measurements (n= 6), two factors were evaluated: ‘translucency’ (three or four levels, depending of commercial brand) and ‘ageing condition’ (base-line, after water storage, and after coffee solution storage). The response-variables tested were cure efficiency, determined by the top/bottom DC ratio, individual L′ C′ h′ color parameters, and CIEDE2000 color difference.
2.2. Materials tested
Four distinct commercially-available resin-based composites indicated for aesthetic restorations were tested [16–20] (Table 1) in their different available translucent/opaque shades: the microhybrid (stated as “nanohybrid” by man- ufacturer) IPS Empress Direct (Ivoclar Vivadent, Schann, Liechtenstein), the nanofilled Filtek Z350 XT (3M ESPE, St Paul, MN, USA), the submicron Estelite Σ Quick (Tokuyama Dental, Tokyo, Japan), and the microhybrid Opallis (FGM, Joinville, SC, Brazil). The materials were classified according to their inorganic content [21]. For this study, the translucency variations within A3 shade were selected due the VITA A3 shade represents one ofthe most common human teeth color [22], besides the more translucent/opaque varieties in this shade.
Table 1 – Commercially available resin-based composite systems selected for this study.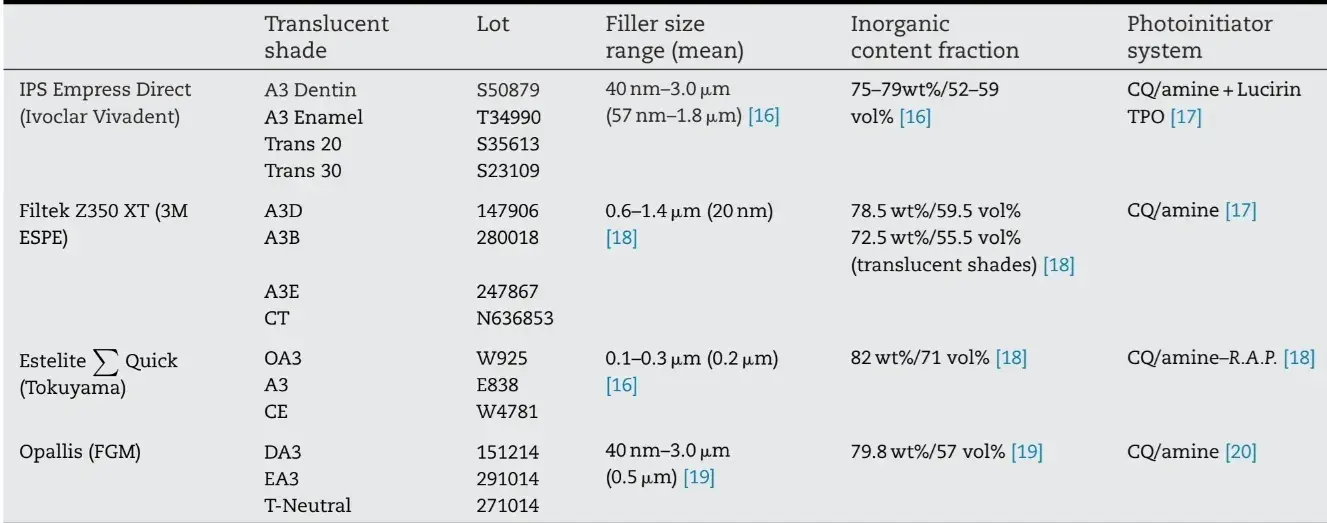
2.3. Optical data and translucency parameter
Six disc-shaped specimens were made for each group using a cylindrical metal mold of 8-mm inner diameter and 2-mm thickness. After the composite insertion, the top surface was covered with a Mylar strip and made flat by pressing down with a glass slab.
The specimens were light-activated for 30 s from the top surface using a large spectrum (385–515nm) lightemitting diode curing unit (Bluephase G2, Ivoclar Vivadent) operated in high mode with irradiance of 1200mW/cm2, as measured with a hand-held radiometer (LED radiometer, Demetron – Kerr, Middleton, WI, USA). Then, all specimens were mechanically polished on both surfaces in a grinding/polishing machine (Buehler, Lake Bluff, IL, USA) with 2000- and then 4000-grit SiC papers under continuous water cooling [9]. After this, the thickness of each specimen was checked with a digital caliper with resolution of 0.01 (Digimatic Caliper, Mitutoyo, Tokyo, Japan).
Optical data (n= 6) was obtained according to the L′ C′ h′ color system in the SCI mode [23], over a zero calibrating box (L* = 0.0, a* = 0.0, and b* = 0.0), using a spectrophotometer equipped with an integrating sphere and diffuse illumination from xenon lamps, with illuminating/measuring geometry d/8◦ (CM-2600d, Konica Minolta Inc., Tokyo, Japan). Illuminating and viewing configurations complied with CIE diffuse/10◦ observer geometry and standard illuminant D65 [24]. The measuring observation area selected was Ø = 3mm [16]. The translucency of each material was quantitatively assessed at baseline by calculating the TP, according to the formula [25]: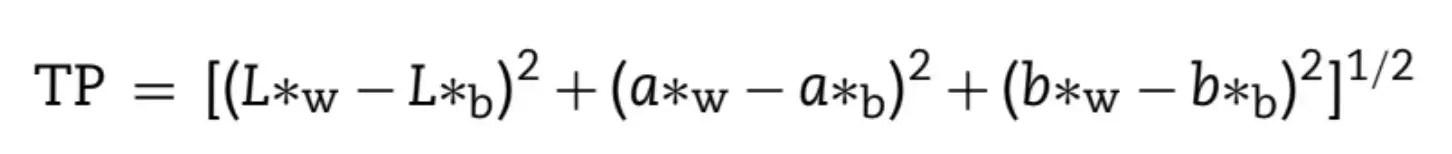
where “w” refers to the color values for each specimen measured over the white background and “b” over the black background. The analyses were carried out with the specimens placed over a black background (Ceramic Colour Standard, Ceram Research Ltd., Stroke-on-Trent, Stafford- shire, UK) with L* = 8.6, a* = −0.7, and b* = −1.5, and a white background (Ceramic Colour Standard, Ceram Research Ltd.) with L* = 93.7, a* = 1.2, and b* = 0.8. A water-based glycerin gel was interposed between the specimen and background to maintain the optical continuity between the translucent material and the opaque backings. Three measurements were taken in the center of the disk’s top surface and the average was considered. The L*, a*, and b* values were automatically provided by the equipment color data software (SpectraMagic NX, Konica Minolta Inc.). In color coordinates, the L* parameter represents the lightness, where 100 is white and 0 is black. The a* and b* parameters are respectively the red–green and yellow–blue chromaticity coordinates. The lightness (L′), chroma (C′), and hue (h′) were then calculated by the formulas [26]: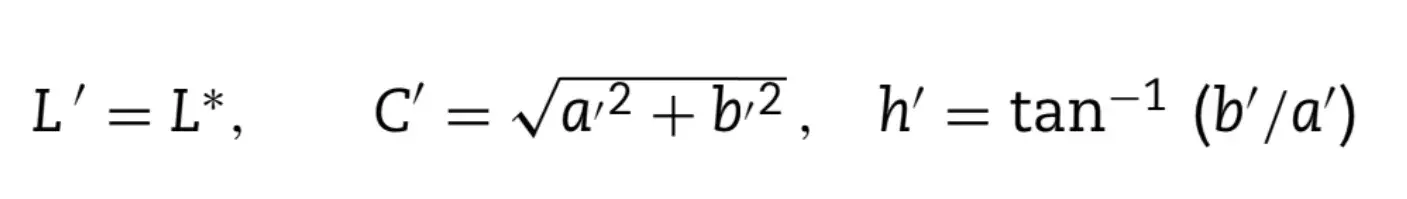
considering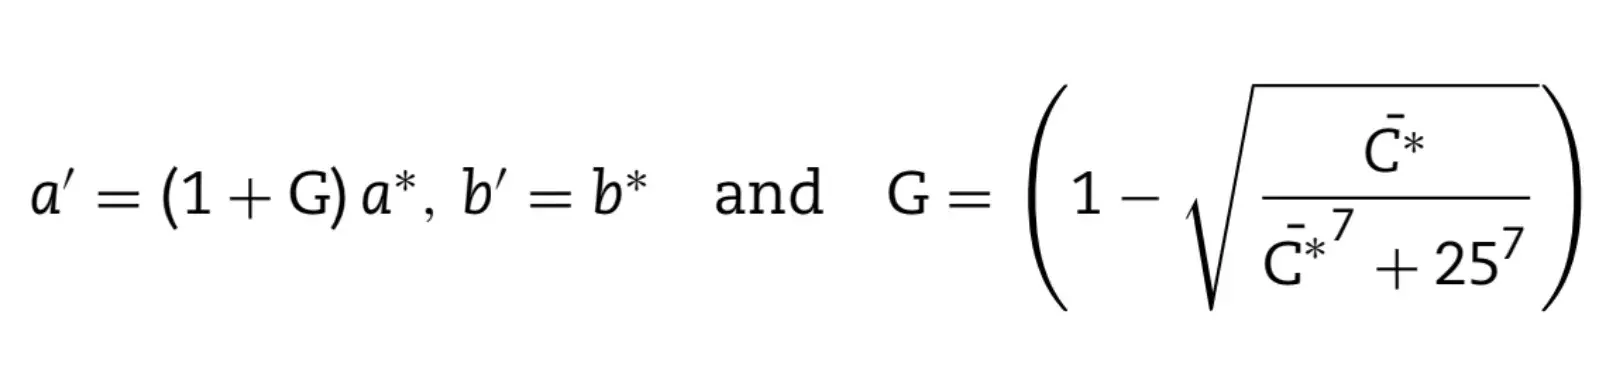
2.4. Degree of C=C conversion and cure efficiency
The cure efficiency analysis (n= 6) was directly evaluated by the DC, investigated with Fourier-transform infrared spectroscopy, using a spectrometer equipped with an attenuated total reflectance (ATR) diamond device (Bürker Optics, Ettlingen, Germany). Each material was placed over the ATR crystal and a spectrum from the uncured material was obtained in the absorbance mode using 32 scans and 4 cm−1 resolution. The material was photoactivated for 30 s at 1200mW/cm2 by the same large spectrum light-emitting diode curing unit used previously, operated in the high mode. The second spectrum was obtained 1min after curing. The DC (in %) was calculated with the following formula: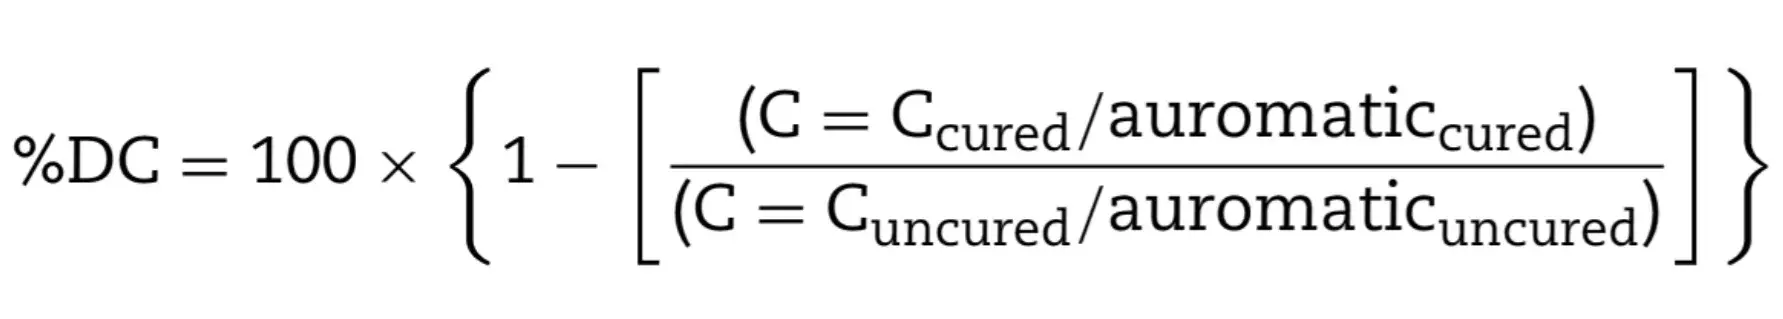
The calculation considered the differences in intensity of C=C stretching vibration (peak area) at 1638 cm−1 of the uncured and cured spectra. The symmetric aromatic stretching at 1608 cm−1 (peak area) was used as internal standard. For each resin composite,the DC was determined attwo differentthicknesses: 0.05mm and 2mm of material over the ATR crystal, in order to correspond to the top and bottom surfaces. The bottom/top ratio was calculated for each material to obtain the cure efficiency.
2.5. Color stability
The CIEDE2000 color difference (ΔE00) was calculated according to the formula [26]: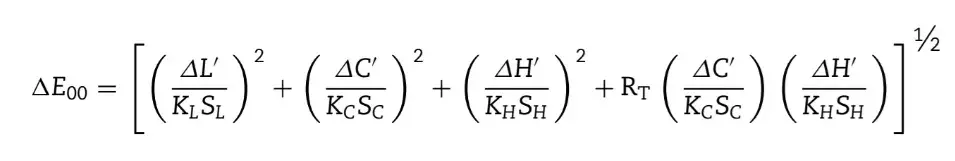
considering: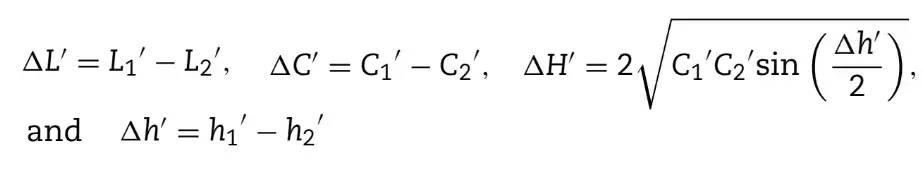
where L′ , C′ and H′ are the mathematical differences in lightness, chroma and hue between two different measurement periods (water storage with baseline and coffee storage with baseline), RT (rotation term) is a function that accounts for the interaction between chroma and hue differences in the blue region, improving the color difference equation performance. For dental color space, the RT value is close to zero [27]. The KLSL, KCSC and KHSC are empirical terms used for weighting the metric differences to the CIEDE2000 differences for each coordinate. Parametric factors were setto KL = 2, KH = 1 and KC = 1 according to the better performance of the Δ E00 equation [28,29]. During !E00 calculation, the discontinuities due to mean hue computation and hue-difference were taken into account, as pointed out previously [30].
Color measurements for all materials were performed in three different periods [9,10] considering the values registered over the black background due the fact that oral cavity background is black [31]. The baseline (T0) values were taken after 24h of specimen’s curing and dry/dark storage. The specimens were immersed in distilled water at 37 ◦C for 30 days (T1) and the color measurements were repeated. The last measurements were performed after the immersion of the specimens in a coffee solution at 37 ◦C for 30 days (T2). The coffee solution was prepared according to a previous study [32].
2.6. Statistical analysis
Statistical analyses were conducted using SigmaPlot® 13.0 software (Systat Software, San Jose, CA, USA). Data for TP was analyzed by one-way analysis of variance (ANOVA). Data for DC at top and bottom surfaces were separately analyzed by two-way ANOVA, considering ‘translucency’ and ‘surface’ as factors. Data for bottom/top DC ratio were submitted to one-way ANOVA. Data for L′ C′ h′ color system parameters and Δ E00 were submitted to two-way ANOVA, considering ‘translucency’ and ‘ageing condition’ as factors. Comparisons among the different commercial resin composites were not performed. Heteroscedastic data were transformed to ranks before the statistical analysis. All pairwise multiple comparisons procedures were performed using the Tukey’s method (α = 0.05). Pearson’s correlation tests were used to analyze the correlation between TP and bottom/top DC ratio, and between TP and Δ E00.
3. Results
Table 2 shows the results for TP. Except for IPS Empress Direct A3 Enamel and Trans 20, TP was statistically different among the different shades for all other materials tested. The DC values according to the materials’ translucent/opaque shades and surfaces are also shown in Table 2. The factor ‘translucency’ affected the DC for all materials, except for Opallis, and the factor ‘surface’ influenced the DC for all materials, except for IPS Empress Direct. For the IPS Empress Direct, the DC at the top surface was statistically higher for A3 Dentin and A3 Enamel shades than Trans 20 and Trans 30, and A3 Dentin shade presented the highest DC at the bottom surface. For the Filtek Z350 XT, CT shade presented the highest DC values at top and bottom surfaces. For Estelite Σ Quick and Opallis, there were no differences among the different translucent shades at top or bottom surfaces. Considering the comparisons between the top and bottom DC values, significant higher DC values were observed at the top surface for A3 Dentin and A3 Enamel from IPS Empress Direct and for A3D and A3B from Filtek Z350 XT. No significant differences were observed for the other groups. Regarding the cure efficiency, no significant difference among the translucent/opaque shades was for any material.
Fig. 1 presents the lightness (L′) values for all materials. The factors ‘translucency’ and ‘ageing condition’ were both significant. For all resin-based composites, the higher the TP, the lower the L, except for Estelite Σ Quick A3 and Opallis EA3, which presented lower L′ values than Estelite Σ Quick CE′ and Opallis T-Neutral, respectively. The water storage did not affect the L′ values for any material while coffee storage decreased L′ for all of them, except Estelite Σ Quick A3.
Fig. 2 presents the chroma (C′) values for all materials. The factors ‘translucency’ and ’ageing condition’ were both significant for IPS Empress Direct, Estelite Σ Quick and Opallis. For Filtek Z350 XT, the factor ‘translucency’ was significant while‘ageing condition’ was not. For all materials, higher TP values were associated with lower C′ values, except for Filtek Z350 XT CT shade. The water storage increased the C′ values for IPS Empress Direct A3 Dentin, Filtek Z350 XT A3D and A3B, OpallisDA3 and EA3, but decreased for Estelite Σ Quick OA3 and A3, and Opallis T-Neutral. The coffee storage increased the C′ values for all materials, except for Filtek Z350 XT CT and Opallis T-Neutral shades which showed decreased C′ values, and for IPS Empress Direct Trans 20 and Trans 30 shades which did not have any significant influence.
Fig. 3 presents the hue (h′) values. For all materials, the factors ‘translucency’ and ‘ageing condition’ were both significant. For all materials, the higher the TP, the higher the h′, except for IPS Empress Direct Trans 20, which present higher h′ than Trans 30. The water storage decreased the h′ values for IPS Empress Direct Trans 30 and Opallis T-Neutral. The coffee storage decreased the h′ values for IPS Empress Direct Trans 20 and Trans 30, for Filtek Z350 XT CT, for Estelite Σ Quick CE, and for Opallis T-Neutral. Δ E00 values for all materials are also shown in Table 2.
For all materials, the factors ‘translucency’ and ‘ageing condition’ were significant. After the coffee storage, the Δ E00 values were significantly higher than after water storage, except for EsteliteΣQuick A3. For all resin-based composites,the higher the TP, the higher the Δ E00, except for IPS Empress Direct A3 Enamel and for Estelite Σ Quick A3. Results for the Pearson’s correlation tests are presented in Table 3. Significant, positive correlations between TP and DC at the bottom surface (r = 0.979, p = 0.021) and between TP and Δ E00 after coffee storage (r = 0.984, p = 0.016) were observed for Filtek Z350 XT. No significant correlations were observed for the other composites tested.
There are additional information about aesthetic composite restorations that you can gain in our course "Composite Veneers: all restorative techniques".
Table 2 – Results for translucency parameter (TP), degree of C C conversion (DC) at top and bottom composite surfaces, bottom/top DC ratio, and CIEDE2000 color difference (Δ E00), considering two periods: T1 (baseline and water storage) and T2 (baseline and coffee solution storage). Values are means ± standard deviations (n= 6).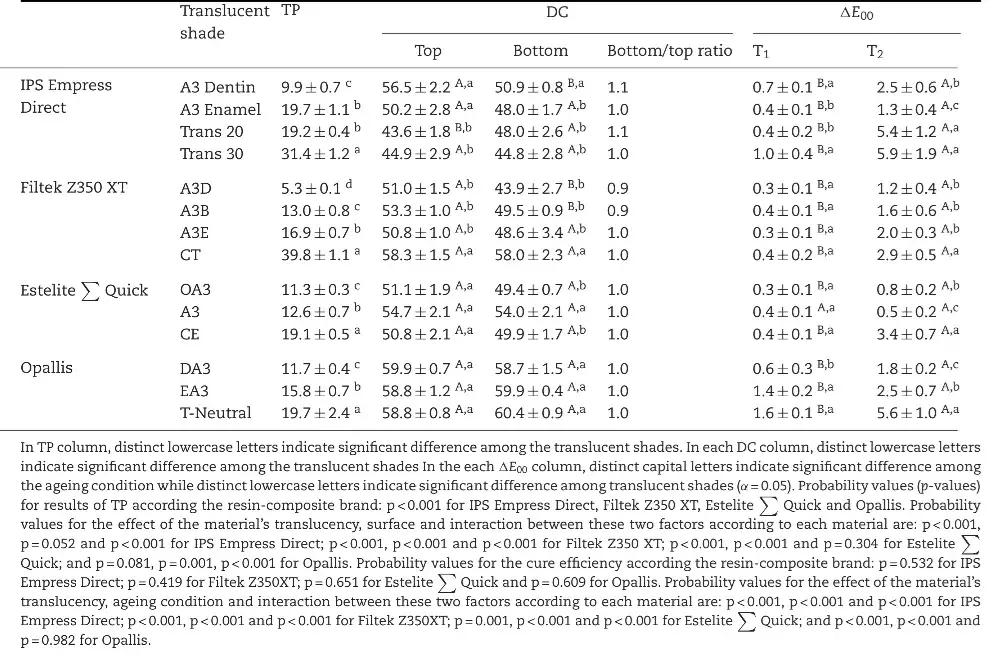
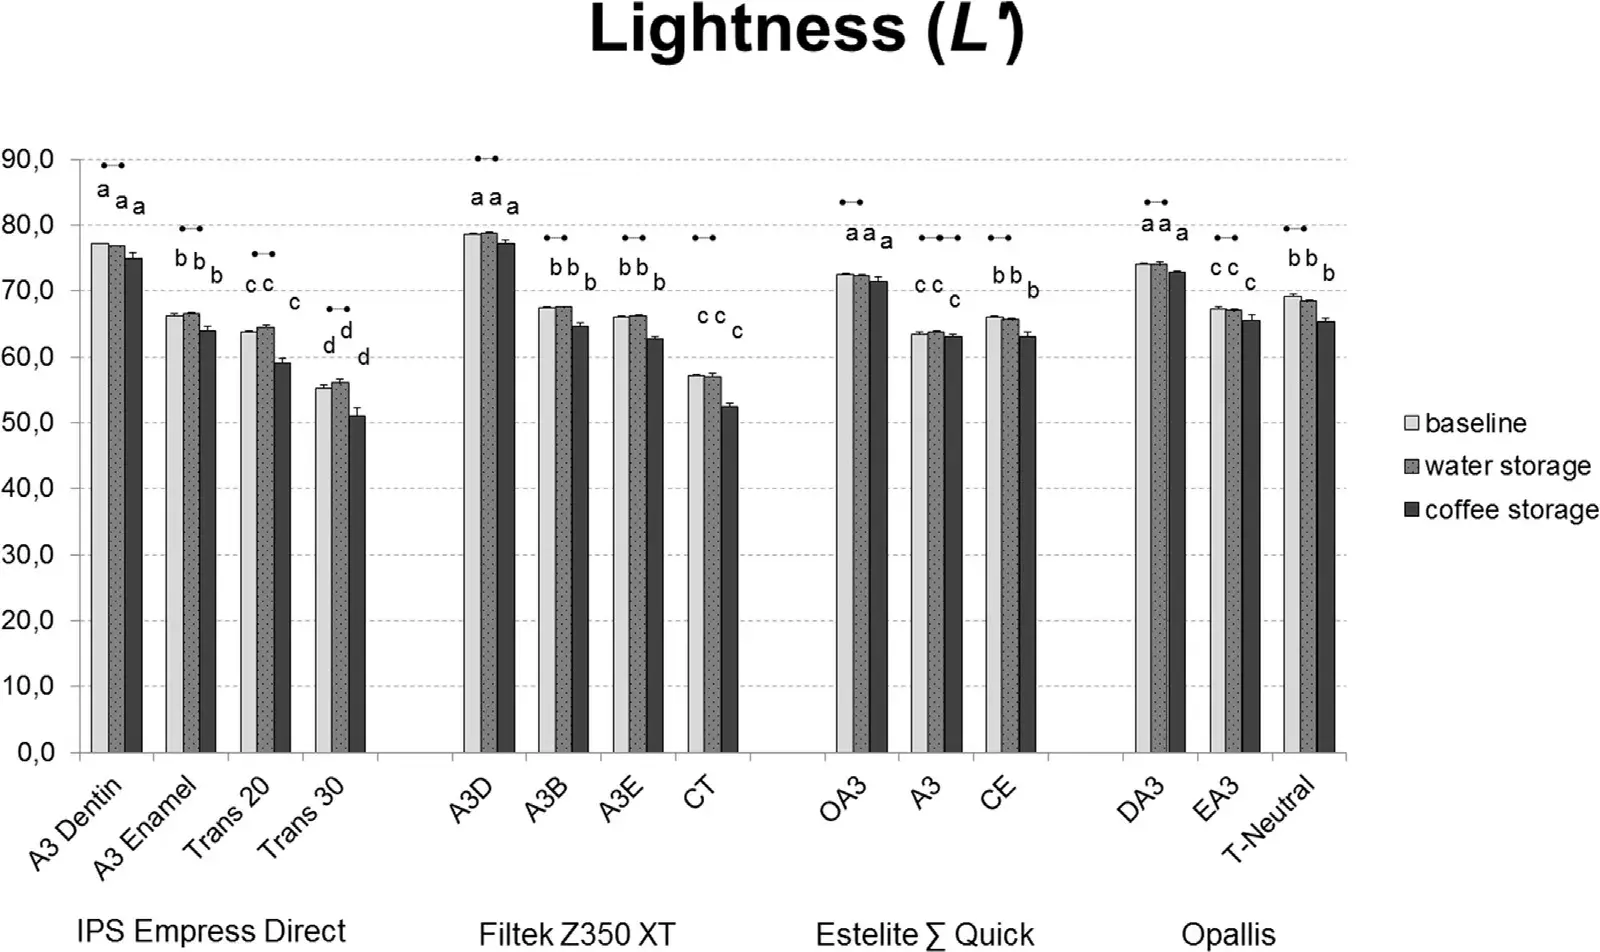 Fig. 1 – Results for lightness (L′) of all resin-based composites evaluated in this study. Bars are mean+ standard deviation (n= 6). Connected dots indicate that the same shade did not present significant changes between the ageing conditions. Different lowercase letters indicate statistical difference among the different translucent/opaque shades in each ageing condition for each resin-based composite brand (α = 0.05).
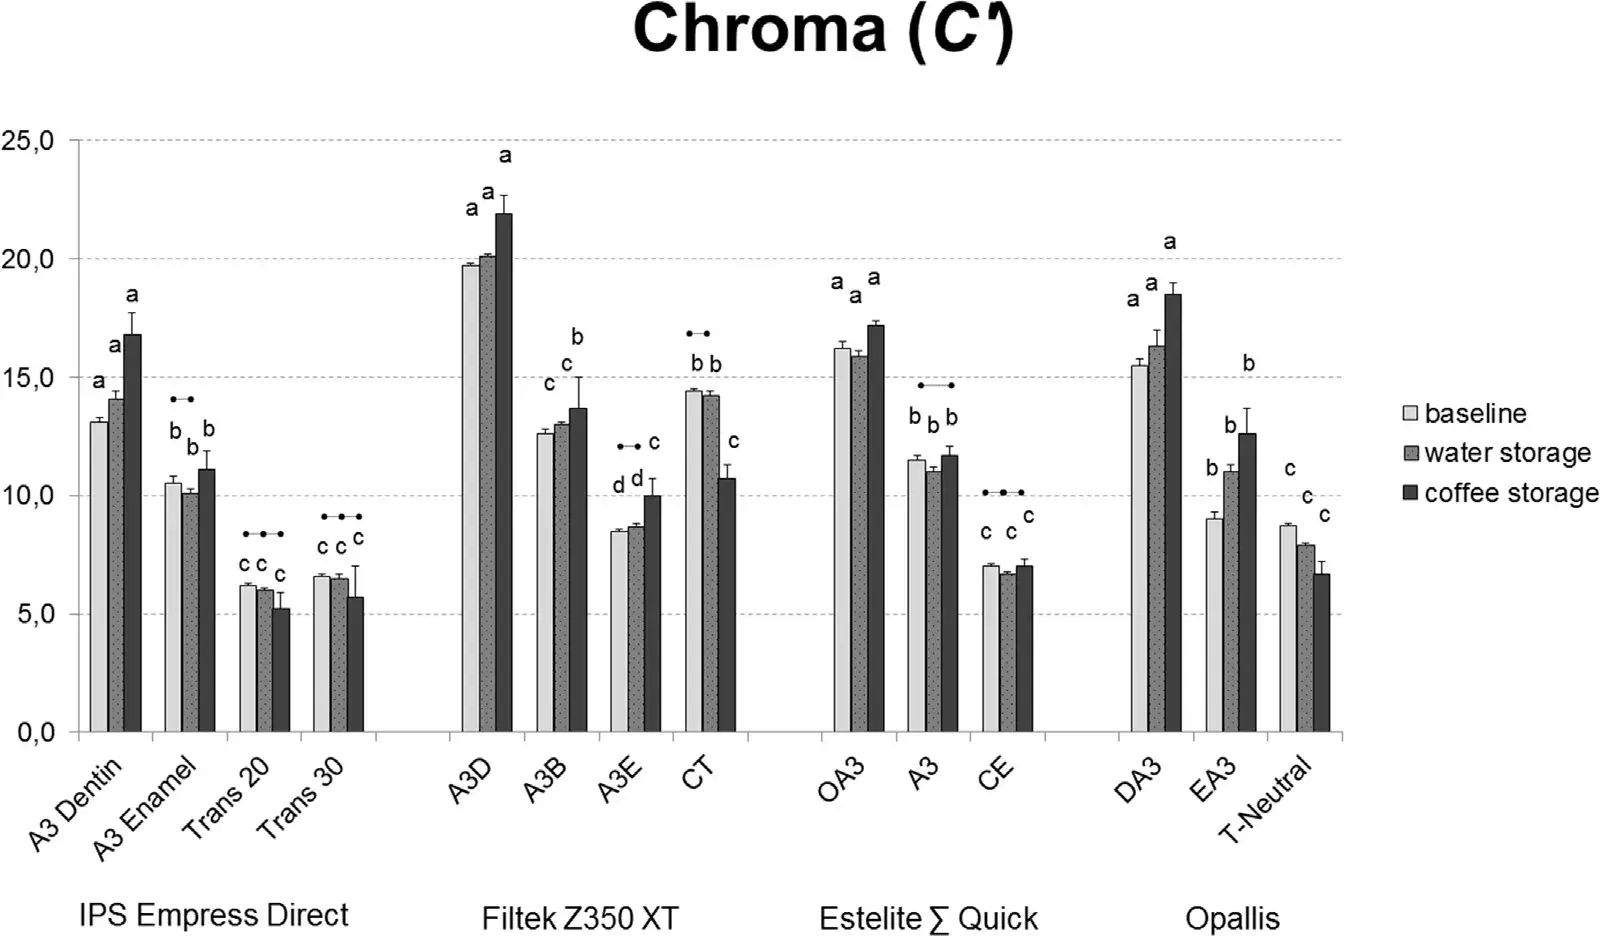 Fig. 2 – Results for chroma (C′) of all resin-based composites evaluated in this study. Bars are mean+ standard deviation (n= 6). Connected dots indicate that the same shade did not present significant changes between the ageing conditions. Different lowercase letters indicate statistical difference among the different translucent/opaque shades in each ageing condition for each resin-based composite brand (α= 0.05).
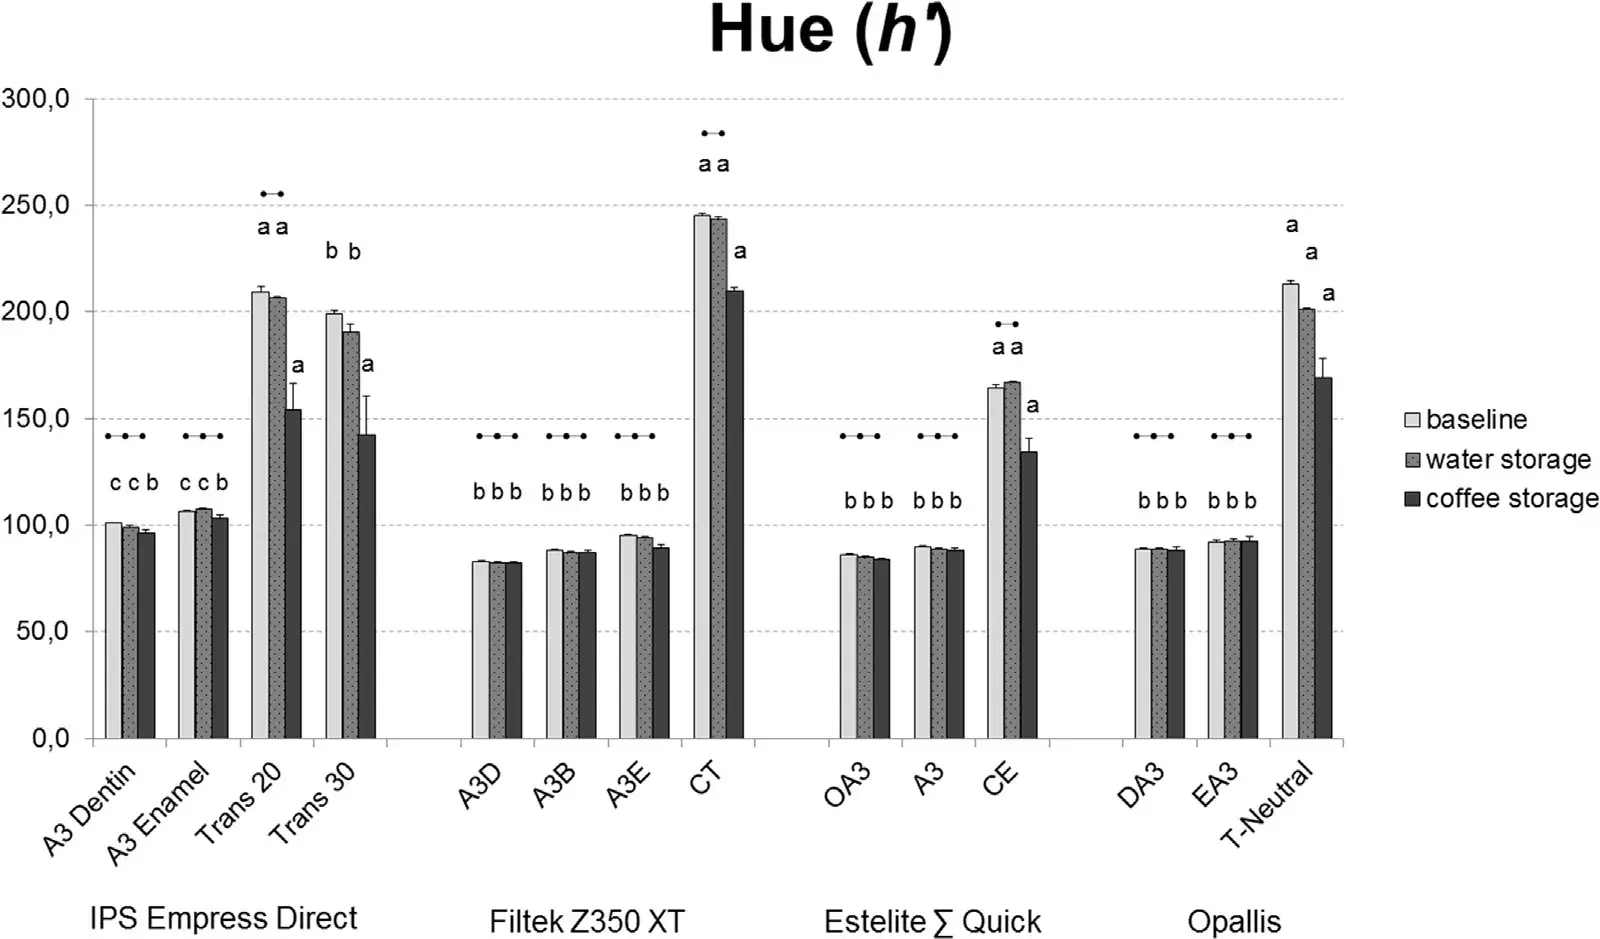 Fig. 3 – Results for hue (h′) of all resin-based composites evaluated in this study. Bars are mean+ standard deviation (n= 6). Connected dots indicate that the same shade did not present significant changes between the ageing conditions. Different lowercase letters indicate statistical difference among the different translucent/opaque shades in each ageing condition for each resin-based composite brand (α = 0.05).
Table 3 – Results for Pearson’s correlation analyses between the translucency parameter (TP) and the degree of C=C conversion (DC) at the top surface, bottom surface, and bottom/top DC ratio, and between the TP and color difference (Δ E00) after water storage (T1) and after coffee storage (T2)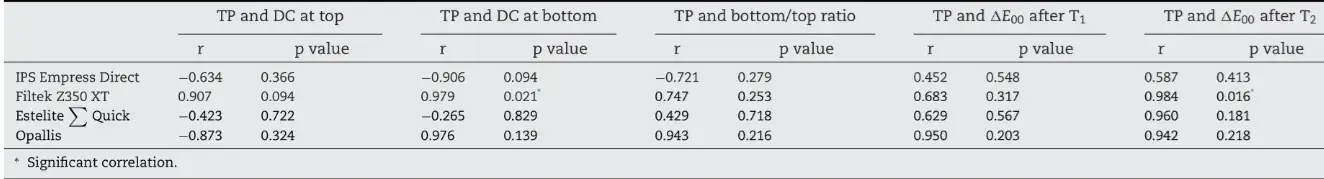
4. Discussion
In the present study, the translucency significantly influenced the DC at the top and bottom surfaces for three of the four commercial materials tested, whereas it did not influence the cure efficiency. Consequently, the first research hypothesis was rejected. During the polymerization reaction, the C C become available for crosslinking with monomers into polymeric chains. There are several factors of resin-based composites’ composition that influence the DC: inorganic content type, shape, and size; resin matrix type and amount; photoinitiator system type and amount. The DC determines the direct restorations’ success, since lower monomer-polymer conversion corresponds to inferior mechanical properties [33] and increased risk for leaching of toxic substances from the material [34]. The cure efficiency of resin-based composites can be directly obtained by the ratio from DC values from bottom and top surfaces, with higher bottom/top DC ratio values meaning higher cure efficiency.
The assumption that high-translucent resin-based composites present higher cure efficiency is justified due to the accentuated light transmission into the material, and consequently high amount of luminous energy reaching deeper surfaces. Nonetheless, the DC is also dependent on the photosensitizer molecules of the initiator system and the manufacturers do not disclose the precise amount of the photoinitiator system and inorganic content for each shade. Diphenyl(2,4,6-trimethylbenzoyl) phosphineoxide (TPO), presented in the formulation of IPS Empress Direct resin-based composite [17], is a high reactive photosensitizer molecule that it is cleaved when it absorbs light, generating reactive molecules which initiates the polymerization process. Unlike CQ, it does not need a co-initiator for effective pho- topolymerization [35]. Data from an in vitro study involving model resin-based composites reports that TPO-based materials presents a higher reactivity rate [14] but lower depth of cure than CQ-based materials [10]. Moreover, the association of TPO with CQ showed improved mechanical properties [10]. Considering the IPS Empress Direct DC results, the high-translucent shades presented lower values in top and bottom surfaces than “enamel” and “dentin” shades. These results might be explained by the TPO reactiveness and consequent polymerization rate. In theory, the high reactiveness of TPO may disrupt or lock the polymer chain propagation and thus decrease the DC. Therefore, polymerization kinetic analysis would be interesting to check this possibility in a future study. Another possibility is that such materials might present variations in monomer combination, which directly affect the DC and color stability [36].
Data from in vitro studies show higher DC for R.A.P. initiator system-based materials compared to traditional CQ/amine-based materials [15]. This was attributed to the R.A.P. initiator potential for high induction of free radicals formation. The results ofthe present study shows that only at bottom surfaces the DC was significantly different for R.A.P. initiator-based materials whereas Estelite Σ Quick A3 shade presents higher DC at bottom than Estelite Σ Quick OA3 and CE shades. This may be associated to a possible R.A.P. initiator reduction in EsteliteΣQuick CE shade or light attenuation due the opacity of Estelite Σ Quick OA3 shade. The effect of this photoinitiator system was minor since there was no difference in the cure efficiency among materials.
The traditional CQ/amine-based resin-based composites of this study, Filtek Z350 XT and Opallis, did not differ in DC among their different translucent shades, except for Filtek Z350 XT CT, which present increased DC at top and bottom surfaces. This could be attributed to the lower inorganic content fraction of Filtek Z350 XT CT shade (72.5 wt% or 55.5 vol%), compared to the Filtek Z350 XT A3D, A3B, and A3E shades (78.5 wt% or 59.5 vol%) or perhaps, due to the alternative photoinitiator molecules present in the composition but not described by the manufacturer.
When translucent materials are submitted to color measurement in reflectance mode, a fraction of the emitted light is lost due to light transmission into the specimen and emission in surfaces outside the perimeter of the observation area [37]. This phenomenon may compromise the accuracy of the color measurement, especially when devices with a small aperture size of the observation window are used. In order to avoid this “edge-loss effect”, some methodologies were proposed, as embedding the specimens in white or black plasticines [38]. In this study, as the specimens’ diameter was much larger than the spectrophotometer’s observation area,the edge-loss effect is negligible, as related previously [16].
For the objective color difference measurement in dentistry, the CIELAB color difference formula has been extensively used. It assumes the uniformity of CIELAB color space and the equal importance of CIELAB individual parameters (L*, a*, and b*) [39]. However, a discrepancy sensitivity on the L*, a*, and b* parameters has been demonstrated concerning visual perceptibility and acceptability thresholds [28,40]. The CIEDE2000 metrics were then proposed for the instrumental color measurement due better indicative of human visual thresholds, even closer with the adjustment of parametric factor KL, KC, and KH set (2:1:1) [29].
The discoloration of resin-based composites takes place due to several factors. The current study selected several translucent-degrees of Vita A3 shade from four different commercial restorative resin-based composites with distinct compositions. Translucency did affect the material’s color stability, confirming the second research hypothesis. The resin-based composites’ color stability is influenced by intrinsic and extrinsic factors. The intrinsic discoloration occurs due to chemical changes inside the material, such as leaching of unreacted monomers by hydrolysis reaction [41] and photoinitiator components not consumed during light exposure [42]. The extrinsic discoloration results from contact and pigment absorption from solutions such as coffee. Pigmentation caused by coffee might occur by surface adsorption of dark pigments and absorption of pigments at the subsurface layer [43]. If the staining goes beyond the superficial layers, it is not possible to remove it by polishing procedures. From the results of this study, the differences among materials after the water and coffee storages may be associated with the inorganic and organic contents. The less the inorganic content, the more the organic content and consequently the more the discoloration due to intrinsic and extrinsic factors [5,44].
Although comparisons among the different commercial systems were not the goal of this study, one common characteristic was observed for all of them: high-translucent materials had the lowest color stability and should be use carefully. It is important to note that not all commercial resin-based composites show a wide range of translucency in their available shades. Despite the improved color stability achieved by TPO-based materials from model resin-based composites studies [9,10,42], the same was not observed with the commercial materials in this study. Although the presence of TPO in IPS Empress Direct’ formulation [17], no beneficial improvement in color stability was observed.
Indeed, the high-translucent shades of IPS Empress Direct demonstrated the lowest color stability and, together with Opallis T-Neutral shade, had the highest averages of color difference. A proper explanation for such behavior might not be related to the photoinitiator system but it could be theorized that it is probably associated with the monomeric blend used in the formulation [36]. An investigation considering the color stability from lowchromatic shades should be interesting. Notwithstanding, an investigation of the optical, surface, and physical properties of the translucent resin-based composites should also be valuable.
Lightness (L′) is an attribute of optical properties which corresponds to the color’s value. The higher the L′, the higher the object’s luminosity. In this study, the highest translucent shades showed the lower L′ values for the IPS Empress Direct, and Filtek Z350 XT materials, which can be explained by the black background influence. In other words, the higher the TP, the lower the L′. However, this phenomenon did not occur in the Estelite Σ Quick and Opallis, where Estelite Σ QuickCE and Opallis T-Neutral presented higher L′ than Estelite Σ Quick A3 and Opallis EA3, respectively. The materials formulation, specifically the distribution of the inorganic content and its relation to light reflectivity, may explain this behavior. The decrease in L′ values due to coffee storage for all materials can be associated with the pigment absorption from this solution, corroborating another study [9].
Hue (h′) and chroma (C′) are the other two color dimensions in the L′ C′ h′ color system. In instrumental color measurement, they can be achieved by the two orthogonal axes (a* and b*) to lightness (L*), converting these coordinates from rectangular to polar form. While h′ represents an angular component of polar representation, the C′ represents the radial component, which corresponds to the intensity of h′ [26]. With the exception of the high-translucent shades, all materials from each resin-based composite brand showed equal h'. The higher h′ presented by the translucent shades may be related to their accentuated translucency, and consequent black background influence. In the same way, it was observed that the C′ was decreased, the higher was the TP, except for the Filtek Z350 XT CT.
Considering the resin-based composite restoration’s longevity, one of the main reasons of clinical failure for anterior and posterior restorations is mechanical deterioration, where tooth and/or restoration fractures represent the most common causes. However, differently from posterior restorations, the failure behavior of the anterior restorations includes lower secondary caries prevalence and higher replacement due esthetic reasons, as restorative material discoloration, surface staining, and marginal mismatch [45]. Although the influence of material’s composition over the restoration’s clinical performance might only be significant after many years of clinical service [1,45], new materials are frequently introduced in the market with promising enhanced properties but without proper evidence from laboratory tests The resin-based composites were improved over the years, with enhanced optical features and higher translucent/opaque shades availability. The restorative concept evolved since the past’s monochromatic restoration to the “dentin paste” cover by “enamel paste”, and then to the use of multiple translucent/opaque shades. In order to reproduce all teeth’s optical characteristics, the use of several translucent/opaque pastes may be necessary to achieve ultimate aesthetics. High-translucent materials can help to reproduce the optical characteristics of tooth’s incisal third. On the other hand, opaque materials are necessary to camouflage the tooth-material interface, hide the dark oral cavity background, cover a blackened substrate, and reproduce the high value need in the tooth’s medium third.
In some cases, these opaque pastes should remain in the restoration buccal surface but the “dentin” and “enamel” nomenclatures to resin-based composite’s different pastes conduct many clinicians to always cover an opaque material (“dentin”) with one translucent (“enamel”), which in turn may commonly lead to esthetic failure due to a mismatch in the value dimension. According to the present results, clinicians might take care when using high-translucent shades due to the possibility of high staining. It is also important to state that in vitro studies have limitations. During the restorative procedure, there are many variables that can interfere on the restoration overall appearance and longevity. Although this study evaluated the different translucent/opaque shades separately, different pastes are associated in a direct restoration, limiting the application of the current outcomes. The mixture of materials from different commercial brands can also occur. Further, the operator ability influences the restoration’s overall esthetic and performance, as well as the factors related to the patient itself as caries risk, eating habits and staining beverages’ consumption also influence the restoration’s longevity.
5. Conclusions
The cure efficiency was not influenced by the material’s translucency, despite their influence on the resin-based composites’ degree of C=C conversion. The color stability, in contrast, was affected by material’s translucency. For all resin-based composite brands, the high-translucent shade presented the lowest color stability.
You have the opportunity to gather more in-depth information about composite restoration protocols in our course "International schools working with composite restorations".
List of authors:
Vinícius Esteves Salgado, Guilherme Ferreira Rego, Luis Felipe Schneider, Rafael Ratto de Moraes, Larissa Maria Cavalcante
References
Baldissera RA, Correa MB, Schuch HS, Collares K, Nascimento GG, Jardim PS, et al. Are there universal restorative composites for anterior and posterior teeth? J Dent 2013;41:1027–35.
Kim JJ, Moon HJ, Lim BS, Lee YK, Rhee SH, Yang HC. The effect of nanofiller on the opacity of experimental composites. J Biomed Mater Res B Appl Biomater 2007;80B:332–8.
Arikawa H, Kanie T, Fujii K, Takahashi H, Ban S. Effect of filler properties in composite resins on light transmittance characteristics and color. Dent Mater J 2007;26:38–44.
Lee YK. Influence of filler on the difference between the transmitted and reflected colors of experimental resin composites. Dent Mater 2008;24:1243–7.
Salgado VE, Cavalcante LM, Silikas N, Schneider LF. The influence of nanoscale inorganic content over optical and surface properties of model composites. J Dent 2013;41:e45–53.
de oliveira DC, de Menezes IR, Gatti A, Correr Sobrinho L, Ferracane JL, Sinhoreti MA. Effect of nanofiller loading on cure efficiency and potential color change of model composites. J Esthet Restor Dent 2016;28:171–7.
Azzopardi N, Moharamzadeh K, Wood DJ, Martin N, van Noort R. Effect of resin matrix composition on the translucency of experimental dental composite resins. Dent Mater 2009;25:564–8.
Arikawa H, Takahashi H, Kanie T, Ban S. Effect of various visible light photoinitiators on the polymerization and color of light-activated resins. Dent Mater J 2009;28:454–60.
Salgado VE, Albuquerque PP, Cavalcante LM, Pfeifer CS, Moraes RR, Schneider LF. Influence of photoinitiator system and nanofiller size on the optical properties and cure efficiency of model composites. Dent Mater 2014;30:e264–71.
Salgado VE, Borba MM, Cavalcante LM, Moraes RR, Schneider LF. Effect of photoinitiator combinations on hardness, depth of cure, and color of model resin composites. J Esthet Restor Dent 2015;27:S41–8.
Palin WM, Senyilmaz DP, Marquis PM, Shortall AC. Cure width potential for MOD resin composite molar restorations. Dent Mater 2008;24:1083–94.
Santini A, Miletic V, Swift MD, Bradley M. Degree of conversion and microhardness of TPO-containing resin-based composites cured by polywave and monowave LED units. J Dent 2012;40:577–84.
Neumann MG, Miranda Jr WG, Schmitt CC, Rueggeberg FA, Correa IC. Molar extinction coefficients and the photon absorption efficiency of dental photoinitiators and light curing units. J Dent 2005;33:525–32.
Schneider LF, Cavalcante LM, Prahl SA, Pfeifer CS, Ferracane JL. Curing efficiency of dental resin composites formulated with camphorquinone or trimethylbenzoyl-diphenyl-phosphine oxide. Dent Mater 2012;28:392–7.
Ilie N, Kreppel I, Durner J. Effect of radical amplified photopolymerization (RAP) in resin-based composites. Clin Oral Investig 2014;18:1081–8.
Kim DH, Park SH. Evaluation of resin composite translucency by two different methods. Oper Dent 2013;38(3):e1–15.
Price RB, Labrie D, Rueggeberg FA, Sullivan B, Kostylev I, Fahey J. Correlation between the beam profile from a curing light and the microhardness of four resins. Dent Mater 2014;30(12):1345–57.
Sabatini C. Color stability behavior of methacrylate-based resin composites polymerized with light-emitting diodes and quartz-tungsten-halogen. Oper Dent 2015;40(3): 271–81.
Rodrigues-Junior S, Chemin P, Piaia P, Ferracane J. Surface roughness and gloss of actual composites as polished with different polishing systems. Oper Dent 2015;40(4):418–29.
Coutinho M, Trevizam NC, Takayassu RN, Leme AA, Soares GP. Distance and protective barrier effects on the composite resin degree of conversion. Contemp Clin Dent 2013;4:152–5.
Ferracane JL. Resin composite — state of the art. Dent Mater 2011;27:29–38.
Elamin HO, Abubakr NH, Ibrahim YE. Identifying the tooth shade in group of patients using Vita Easyshade. Eur J Dent 2015;9(2):213–7.
Hosoya Y, Shiraishi T, Oshiro M, Ando S, Miyazaki M, Powers JM. Effects of specular component on color differences of different filler type resin composites after aging. J Dent 2009;37(8):585–90.
CIE (Commission Internationale de l’ Eclairage). Colorimetry − technical report. 3rd ed. Viena: CIE Pub; 2004.
Johnston WM, Ma T, Kienle BH. Translucency parameter of colorants for maxillofacial prostheses. Int J Prosthodont 1995;8:79–86.
Luo MR, Cui G, Rigg B. The development of the CIE 2000 colour-difference formula: CIEDE2000. Color Res Appl 2001;26(5):340–50.
Pérez MM, Saleh A, Yebra A, Pulgar R. Study of the variation between CIELAB delta E* and CIEDE2000 color-differences of resin composites. Dent Mater J 2007;26(1):21–8.
Pérez MM, Ghinea R, Herrera LJ, Ionescu AM, Pomares H, Pulgar R, et al. Dental ceramics: a CIEDE2000 acceptability thresholds for lightness, chroma and hue differences. J Dent 2011;39(3):e37–44.
Pecho OE, Ghinea R, Alessandretti R, Pérez MM, Della Bona A. Visual and instrumental shade matching using CIELAB and CIEDE2000 color difference formulas. Dent Mater 2016;32(1):82–92.
Sharma G, Wu W, Dalal EN. The CIEDE2000 color-difference formula: Implementation notes, supplementary test data, and mathematical observations. Color Res Appl 2005;30(1):21–30.
Guinea R, Pérez MM, Herrera L.Rivas MJ, Yebra A, Paravina RD. Color difference thresholds in dental ceramics. J Dent 2010;38:e57–64.
Ertas E, Güler AU, Yucel AC, Köprülü H, Güler E. Color stability of resin composites after immersion in different drinks. Dent Mater J 2006;25:371–6.
Ruyter IE. Methacrylate-based polymeric dental materials: conversion and related properties. Summary and review. Acta Odontol Scand 1982;40:359–76.
Spahl W, Budzikiewicz H, Geurtsen W. Determination of leachable components from four commercial dental composites by gas and liquid chromatography/mass spectrometry. J Dent 1998;26:137–45.
Neumann MG, Schmitt CC, Ferreira GC, Correa IC. The initiating radical yields and the efficiency of polymerization for various dental photoinitiators excited by different light curing units. Dent Mater 2006;22:576–84.
Fonseca AS, Labruna Moreira AD, de Albuquerque PP, de Menezes LR, Pfeifer CS, Schneider LF. Effect of monomer type on the CC degree of conversion, water sorption and solubility, and color stability of model dental composites. Dent Mater 2017;33(4):394–401.
Johnston WM, Hesse NS, Davis BK, Seghi RR. Analysis of edge-losses in reflectance measurements of pigmented maxillofacial elastomer. J Dent Res 1996;75(2):752–60.
Yu B, Ahn J, Lee Y. Measurement of translucency of tooth enamel and dentin. Acta Odontol Scand 2009;67(1):57–64.
Mangine H, Jakes K, Noel C. A preliminary comparison of CIE color differences to textile color acceptability using average observes. Color Res Appl 2005;30(4):288–94.
Lee YK, Lim BS, Rhee SH, Yang HC, Powers JM. Color and translucency of A2 shade resin composites after curing, polishing and thermocycling. Oper Dent 2005;4:436–42.
Ferracan JL, Berge HX, Condon JR. In vitro aging of dental composites in water — effect of degree of conversion, filler volume, and filler/ matrix coupling. J Biomed Mater Res 1998;42:465–72.
Albuquerque PP, Moreira AD, Moraes RR, Cavalcante LM, Schneider LF. Color stability, conversion, water sorption and solubility of dental composites formulated with different photoinitiator systems. J Dent 2013;41(3):e67–72.
Dietschi D, Campanile G, Holz J, Meyer JM. Comparison of the color stability of ten new-generation composites: an in vitro study. Dent Mater 1994;6:353–62.
Salgado VE, Cavalcante LM, Moraes RR, Davis HB, Ferracane JL, Schneider LF. Degradation of optical and surface properties of resin-based composites with distinct nanoparticle sizes but equivalent surface area. J Dent 2017;59:48–53.
Demarco FF, Collares K, Coelho-de-Souza FH, Correa MB, Cenci MS, Moraes RR, et al. Anterior composite restorations: a systematic review on long-term survival and reasons for failure. Dent Mater 2015;31(10):1214–24.